- BTC/USD struggles to find direction on Friday, trades in a very tight range amid a lack of fresh catalysts.
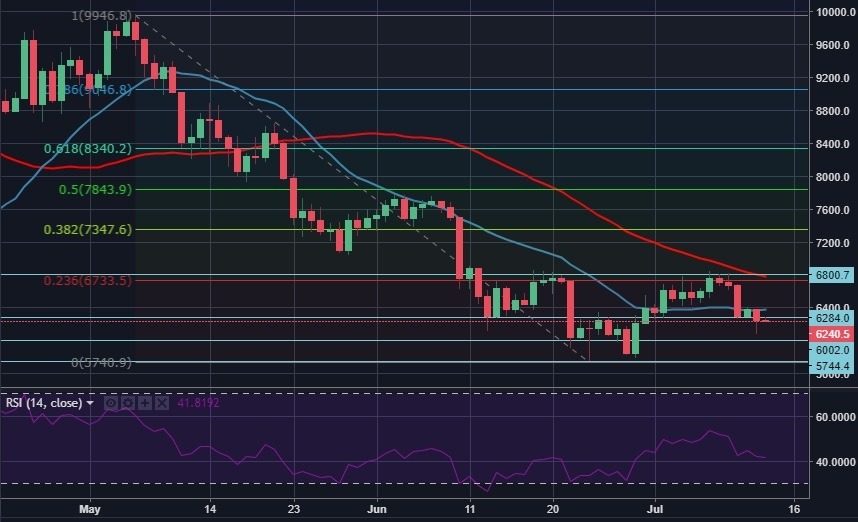
- The RSI on the daily chart moves sideways near the 40 mark, suggesting that the next direction is still likely to be south.
- The 20-DMA (blue line) acts as a dynamic resistance.
Spot rate: 6240
Relative change: -0.13%
High: 6286
Low: 6220
Trend: Bearish
Support 1: 6000 (psychological level/static support).
Support 2: 5750 (2018 low/Jun. 24 low).
Support 3: 5500 (Oct. 24, 2017, low).
Resistance 1: 6380 (20-DMA).
Resistance 2: 6800 (Fibo. 23.6% retracement of May 6 – Jun. 24 fall).
Resistance 3: 7350 (Fibo. 38.2% retracement of May 6 – Jun. 24 fall).
