Home Bitcoin Technical  Analysis: BTC/USD massively defies the odds and the textbook
Crypto News

Bitcoin Technical  Analysis: BTC/USD massively defies the odds and the textbook

  • Bitcoin price jumps around 2% higher on Thursday, after a decent surprise bounce late on Wednesday,
  • BTC/USD was moving within a bearish pennant, which appeared set up for another leg lower.
  • Bulls managed to escape the pennant and resistance, which at the time was seen at $6335.


BTC/USD 4-hour chart  
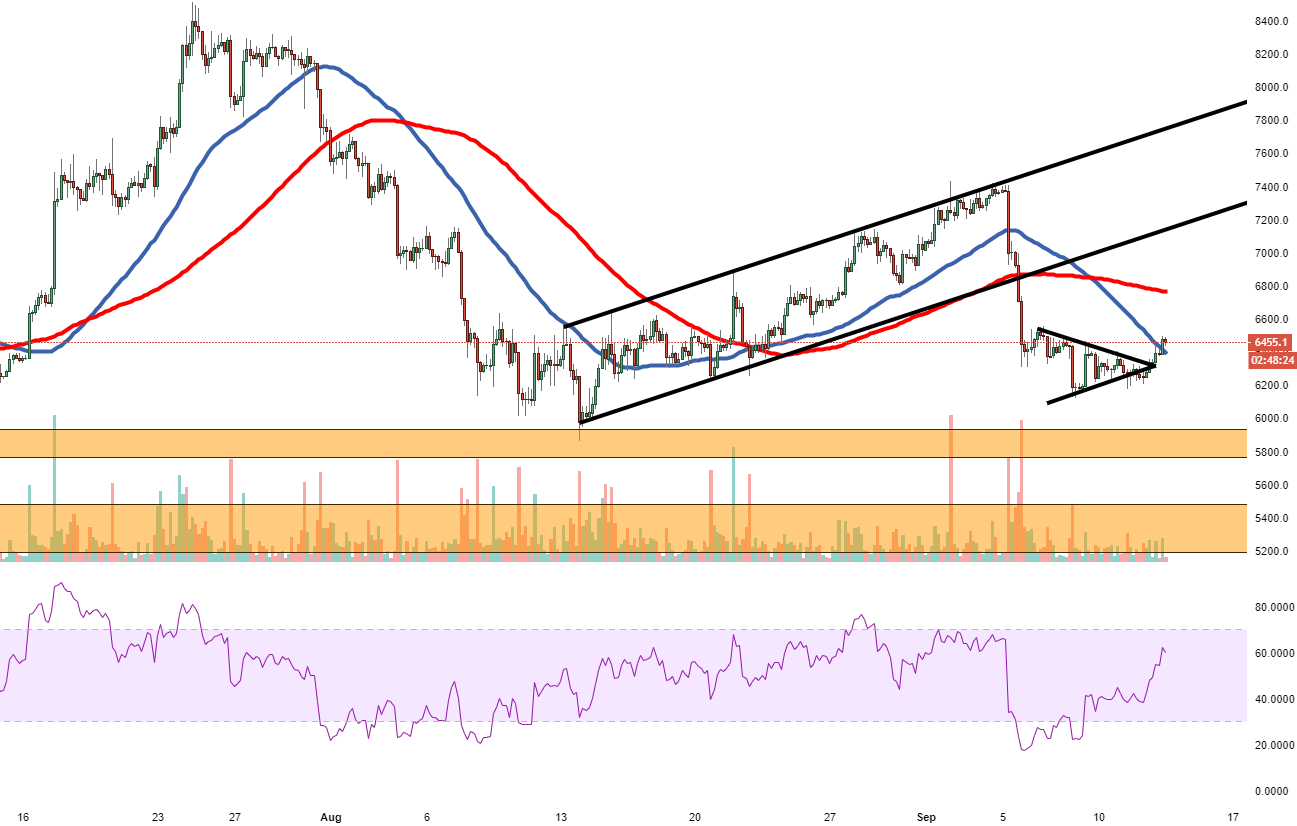


Spot rate:                    6463.7

Relative change:        +2.06%

High:                           6490.0

Low:                            6333.4


Trend:                         Bullish


Support 1:                   6405.0, 50MA.

Support    2:                  6325.5,  on top of broken pennant.  

Support    3:                  6230.0, demand area.

Resistance 1:              6385.0, resistance on 4-hour chart.

Resistance 2:             6760.9, 100MA.

Resistance 3:             7100.0, underneath the broken ascending channel, which triggered sell-off.


FX Street

FX Street

FXStreet is the leading independent portal dedicated to the Foreign Exchange (Forex) market. It was launched in 2000 and the portal has always been proud of their unyielding commitment to provide objective and unbiased information, to enable their users to take better and more confident decisions.