- Bitcoin price is trading up in very minor negative territory in the second half of the session on Monday, down some 0.10%
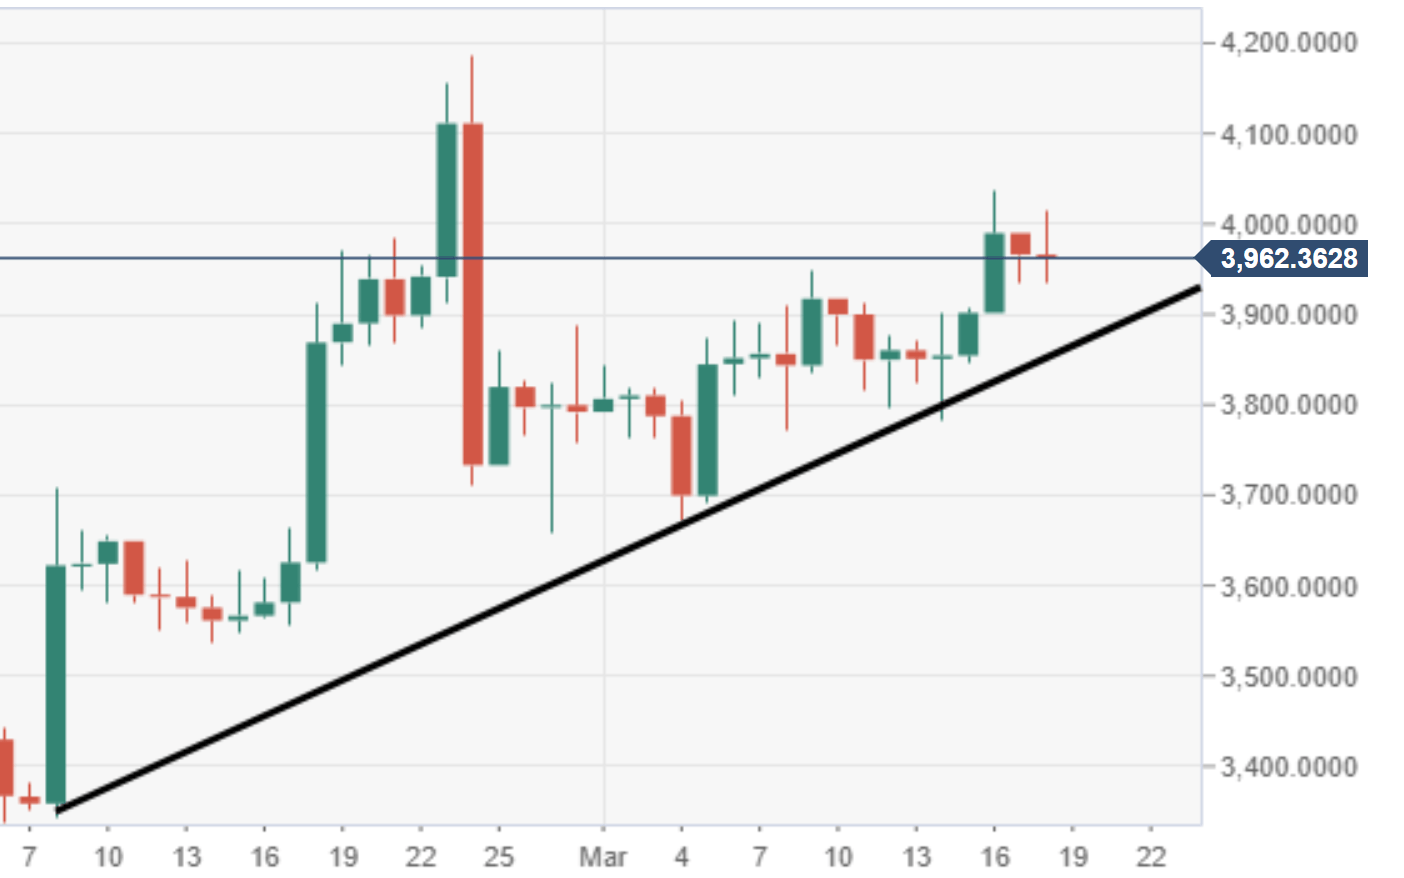
- BTC/USD is still very much reliant on a long-running ascending trend line, which has been in play since early February.
- Near-term demand zone continues to prop up the price within the early $3900.
Spot rate: 3961.50
Relative change: -0.10%
High: 4015.61
Low: 3961.60
Trends:
Daily SMA20: 3848.95
Daily SMA50: 3698.23
Daily SMA100: 3683.46
Daily SMA200: 4909.48
Levels:
Previous Daily High: 3991.08
Previous Daily Low: 3933.64
Previous Weekly High: 3917.33
Previous Weekly Low: 3783.86
Previous Monthly High: 4187.25
Previous Monthly Low: 3338.98
Daily Fibonacci 38.2%: 3955.58
Daily Fibonacci 61.8%: 3969.14
Daily Pivot Point S1: 3936.11
Daily Pivot Point S2: 3906.16
Daily Pivot Point S3: 3878.67
Daily Pivot Point R1: 3993.55
Daily Pivot Point R2: 4021.03
Daily Pivot Point R3: 4050.99
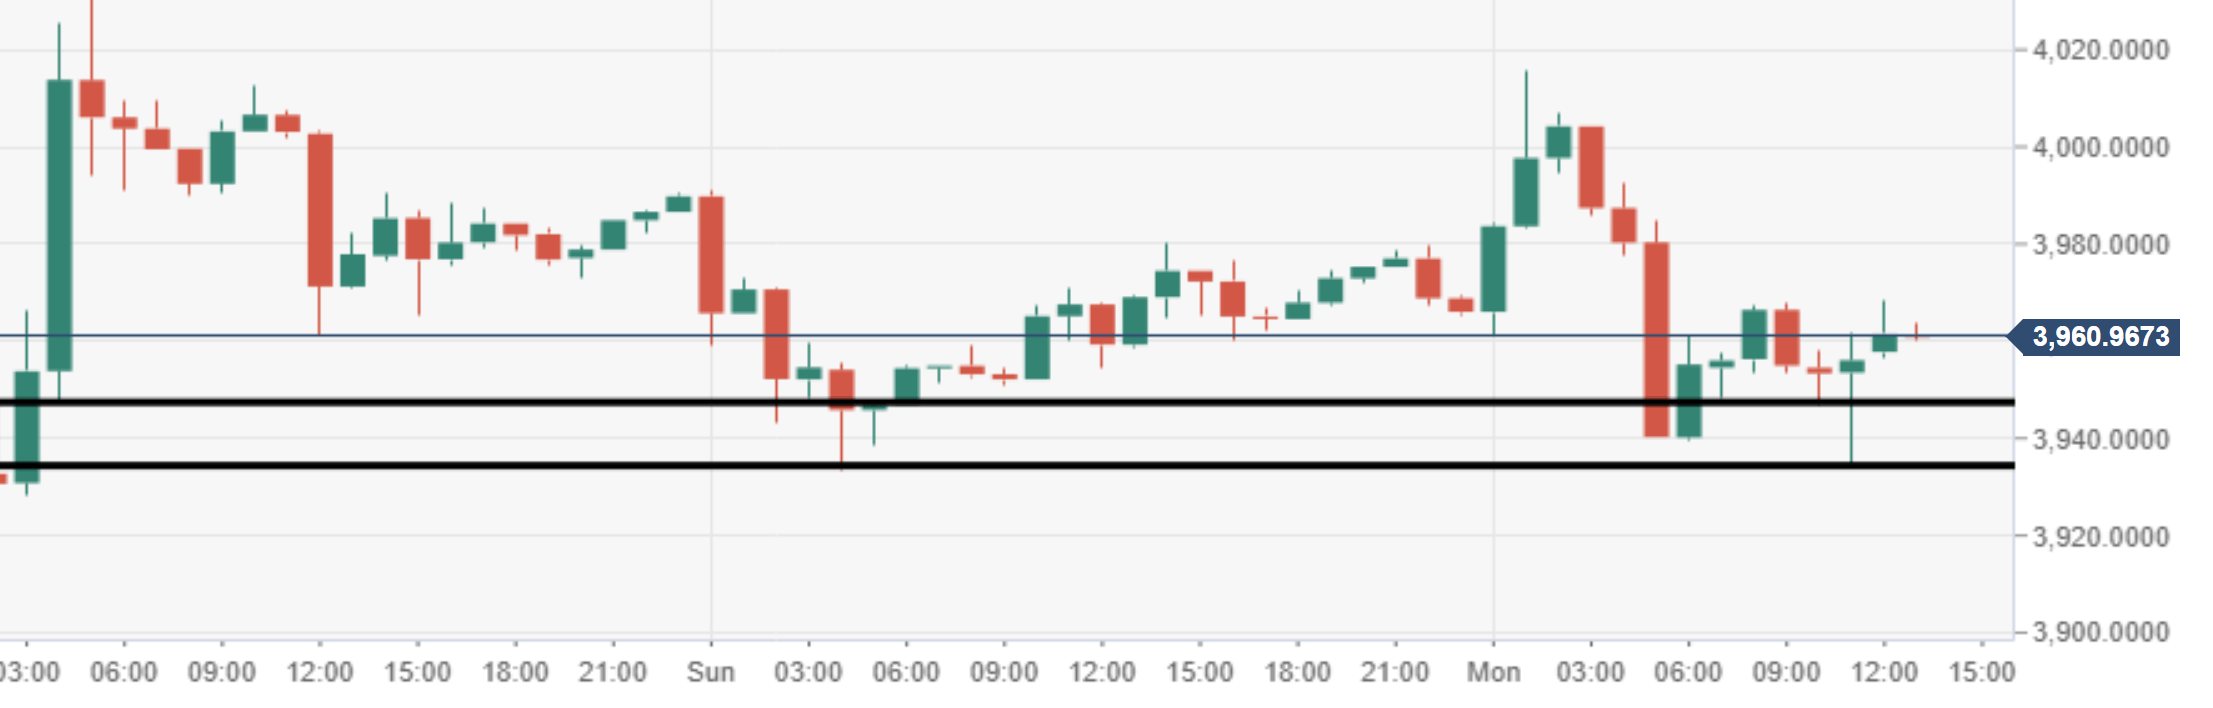
BTC/USD 60-minute chart
- Decent demand can be observed within the $3940 price area, as seen via the 60-minute chart view.
- Supply can be observed running within the very early $4000 price region.
BTC/USD daily chart
- Vital near-term ascending trend line still providing necessary support for the current trend north.
- There is much supply heading into the early $4000 price territory.