- Bitcoin price into the second half of the session on Friday was trading in very minor positive territory by some 0.35%.
- BTC/USD remains firmly supported by strong daily ascending trend line, which has been in play since early February.
- The bulls must breakdown $4000 for greater upside pressure, as sellers continue to cap upside.
Spot rate: 3993.60
Relative change: +0.35%
High: 3998.09
Low: 3961.28
Trend: Bullish
BTC/USD 60-minute chart
- Bearish rising wedge pattern eyed via the 60-minute chart view, subject to a potential breakout to the downside. Focus on $4000, this needs to be broken down for greater upside momentum.
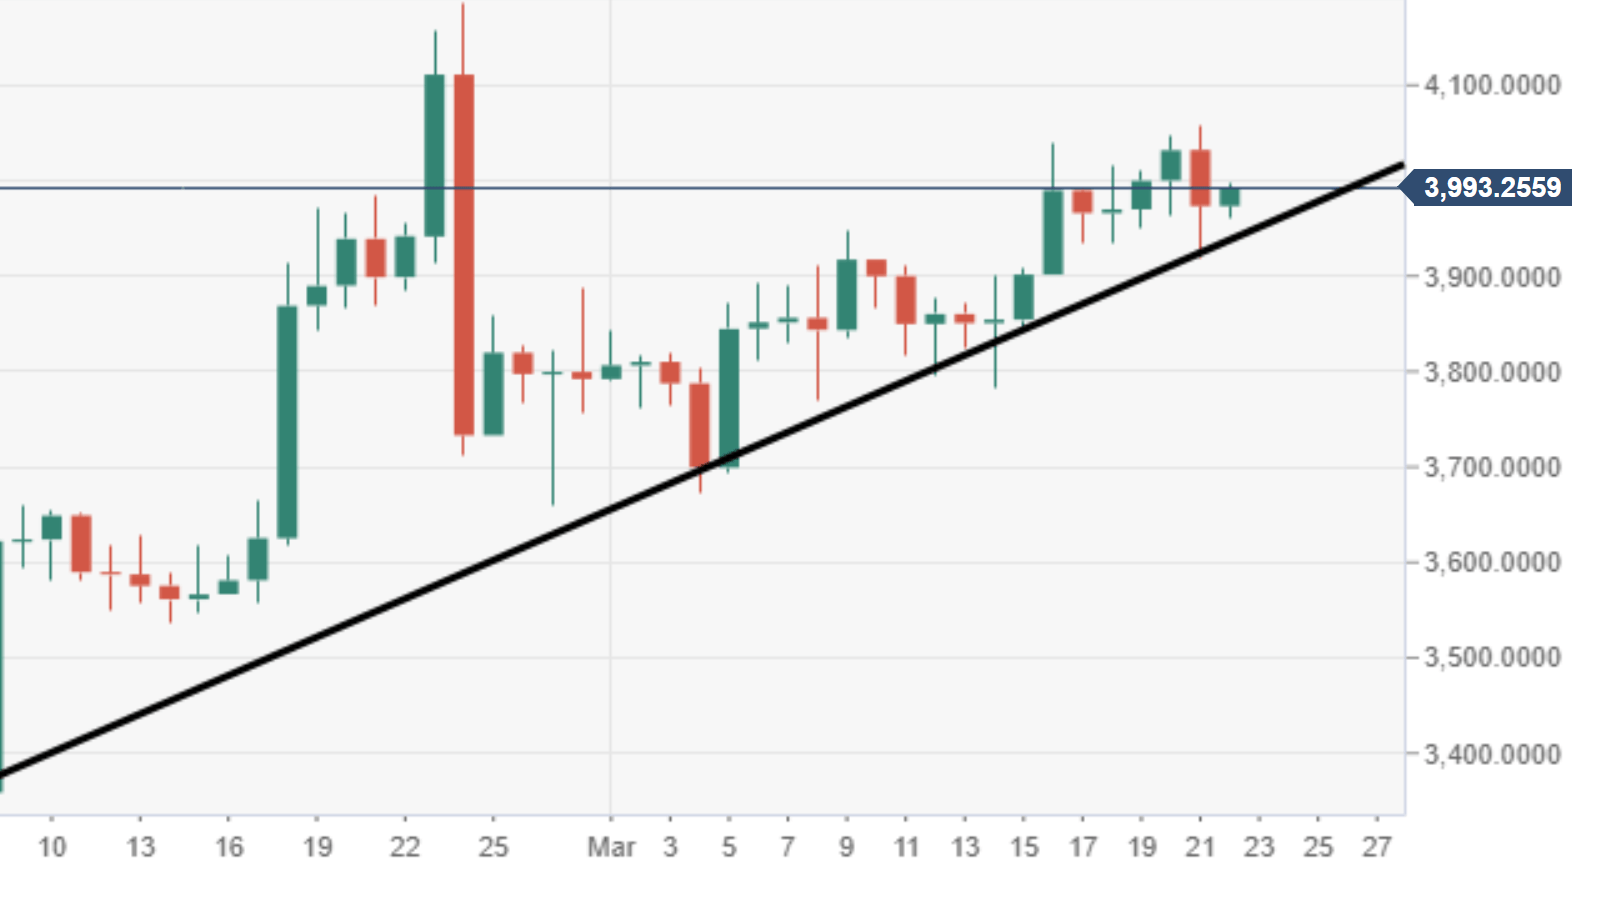
BTC/USD daily chart
- Bulls remain well-supported for their attempt to push further north by a long-running ascending trendline.

