- Bitcoin loses large ground, after worries are sparked on Indian banks close to stop dealing with cryptocurrency related companies.
- BTC/USD price breaks out from a rising wedge pattern, in a forceful move south.
BTC/USD 60-minute chart
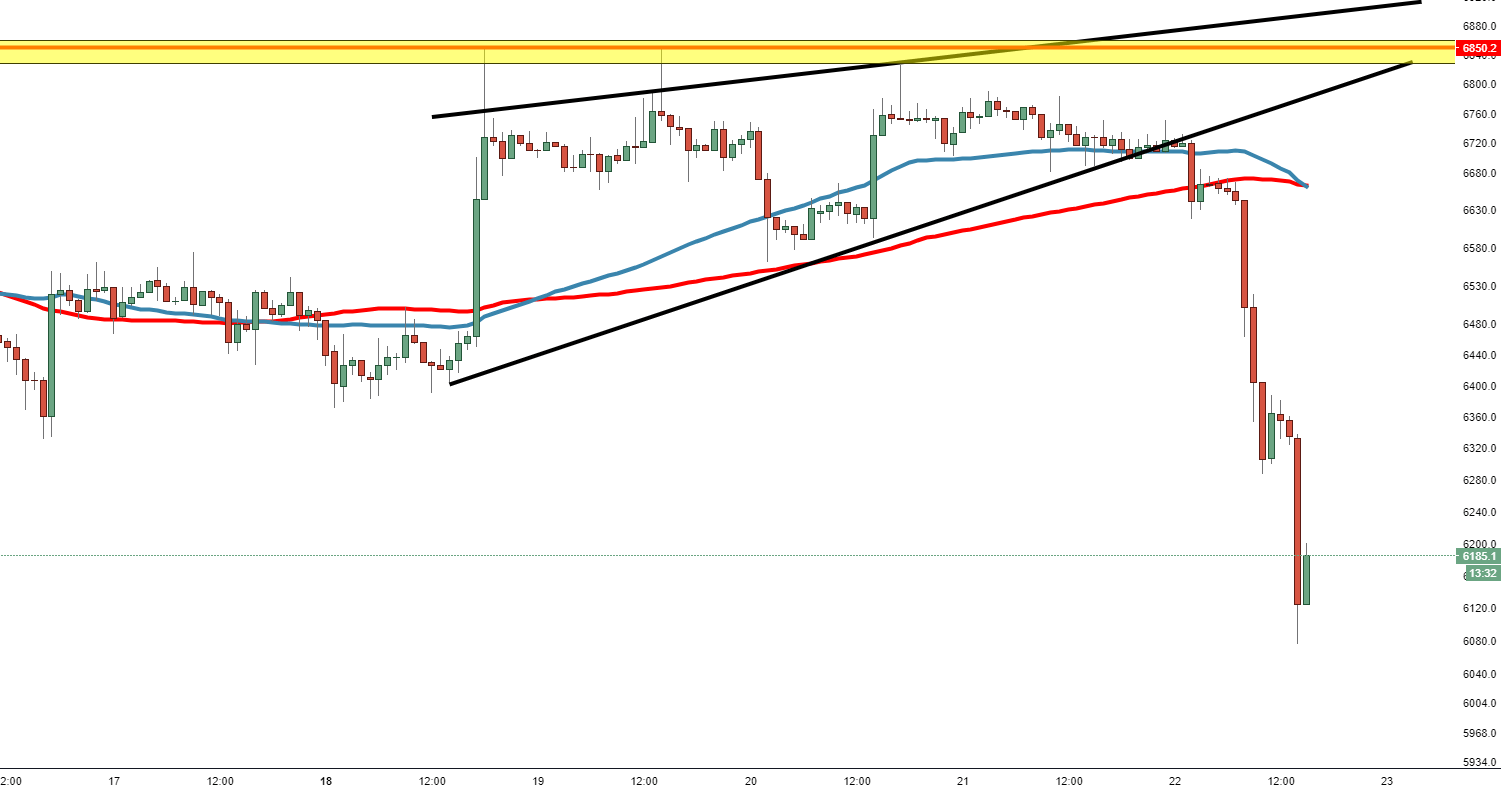
Spot rate: 6180.0
Relative change: -8.00%
High: 6731.0
Low: 6075.0
Trend: Bearish
Support 1: 6110.2, (support on 30-minute chart) & 13th June low.
Support 2: 6010.40, 2nd June low.
Support 3: 5838.60 demand zone.
Resistance 1: 6725.0, underneath broken wedge pattern.
Resistance 2: 6850.2, (resistance on 60-minute chart).
Resistance 3: 6898.0 11th June high.
