- Bitcoin price in the second half of Tuesday is trading in minor positive territory, gains of around 1%.
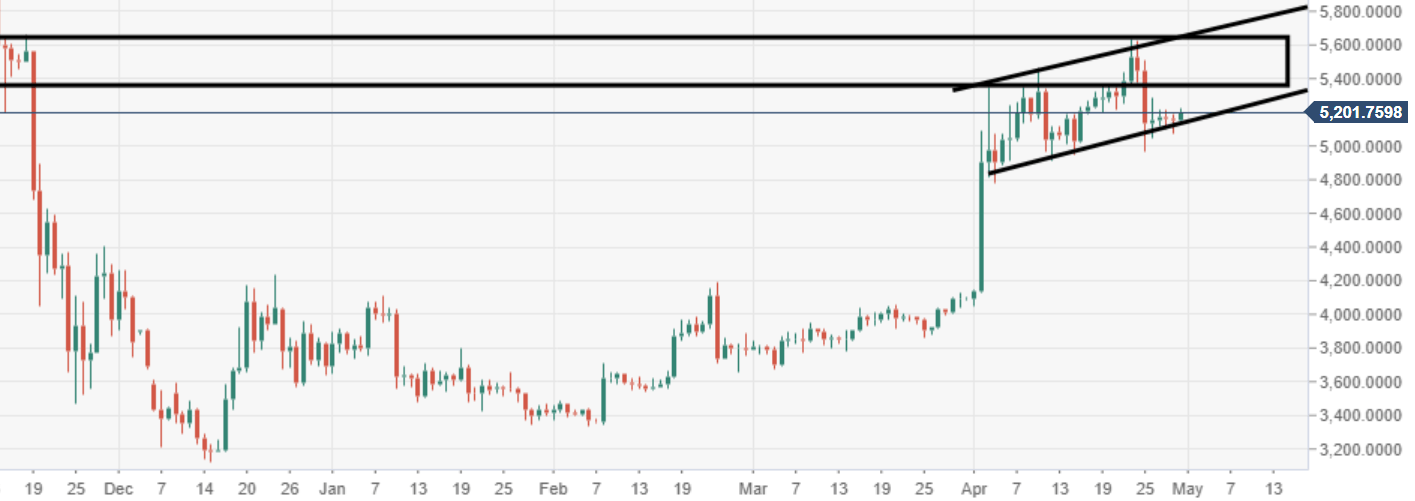
- BTC/USD is moving within a bullish flag structure seen via the daily chart view, subject to a breakout.
- There is a strong area of support – demand protecting the $5000, which could very well be the new bottom area.
Spot rate: 5201.76
Relative change: -0.95%
High: 5219.93
Low: 5129.19
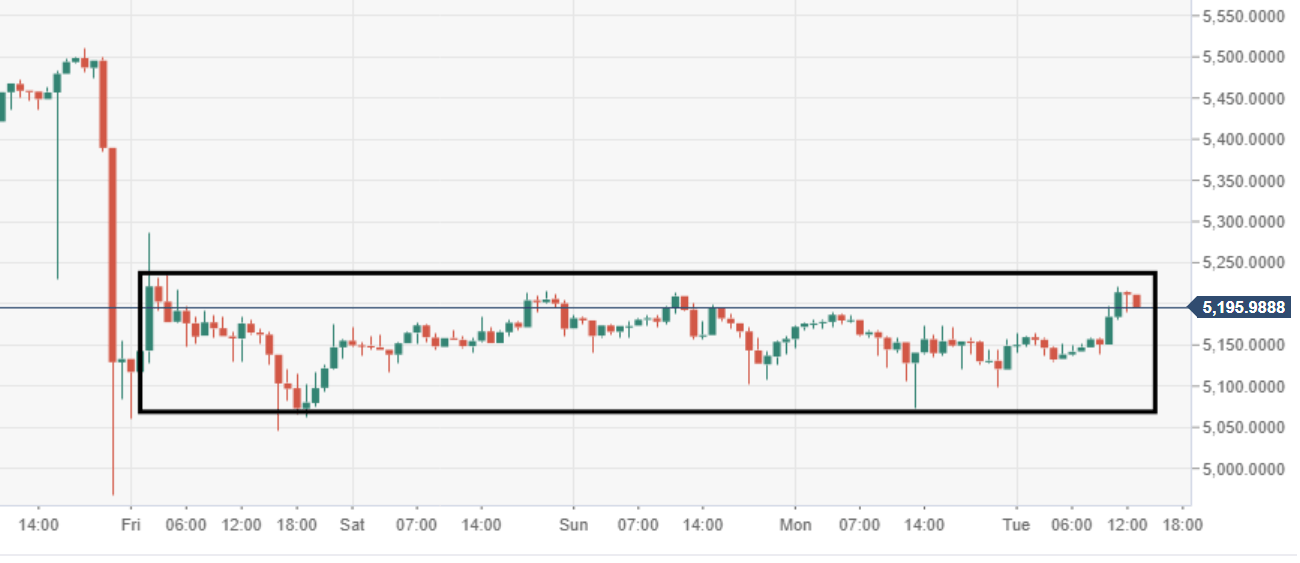
BTC/USD 60-minute chart
- Near-term chart view via the 60-minute is moving within a bearish flag pattern, subject to a breakout south, contradictory of the daily view.
BTC/USD daily chart
- Price action via the daily chart view is moving within a bullish flag pattern formation.