- Bitcoin price on Monday trading up with minor gains of 1.5% into the second half of the day.
- BTC/USD despite the gains in the session so far, does remain vulnerable to further downside pressure.
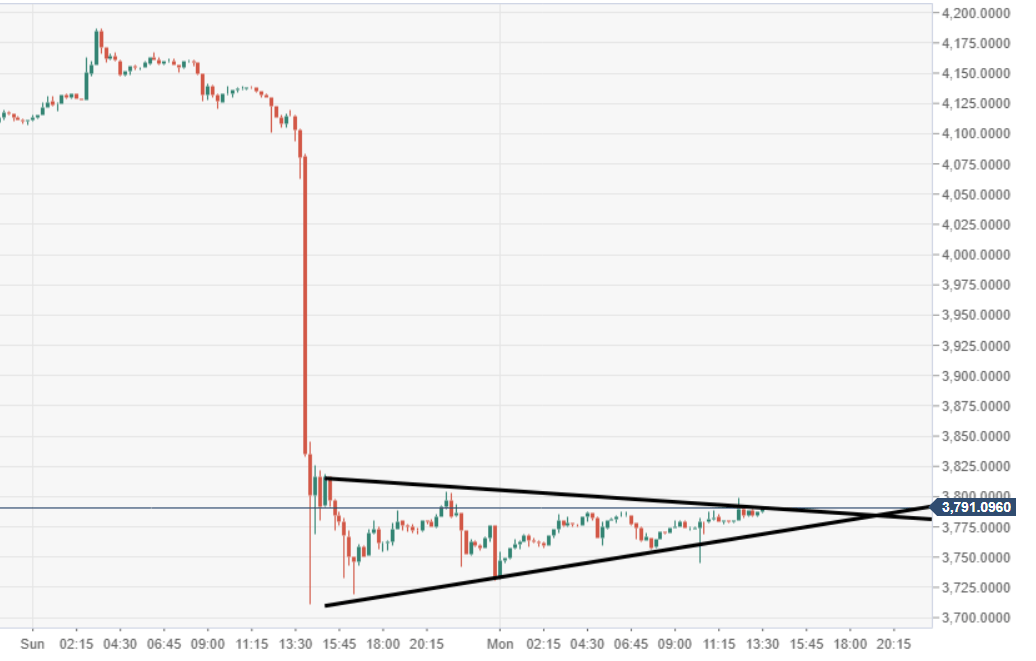
BTC/USD 15-minute chart
- Price action is narrowing within a bearish pennant pattern structure. Near-term support eyed at $3767, lower acting trend line. ]

Spot rate: 3789.89
Relative change: +1.52%
High: 3798.49
Low: 3732.06
Trend: Bullish
Trends:
Daily SMA20: 3651.62
Daily SMA50: 3626.08
Daily SMA100: 3859.74
Daily SMA200: 5185.58
Levels:
Previous Daily High: 4187.25
Previous Daily Low: 3711.49
Previous Weekly High: 3984.92
Previous Weekly Low: 3556.71
Previous Monthly High: 4110.71
Previous Monthly Low: 3341.58
Daily Fibonacci 38.2%: 3893.23
Daily Fibonacci 61.8%: 4005.51
Daily Pivot Point S1: 3567.34
Daily Pivot Point S2: 3401.54
Daily Pivot Point S3: 3091.58
Daily Pivot Point R1: 4043.1
Daily Pivot Point R2: 4353.05
Daily Pivot Point R3: 4518.86
BTC/USD 60-minute chart
- Near-term bearish pennant pattern formation eyed via the 60-minute chart view.
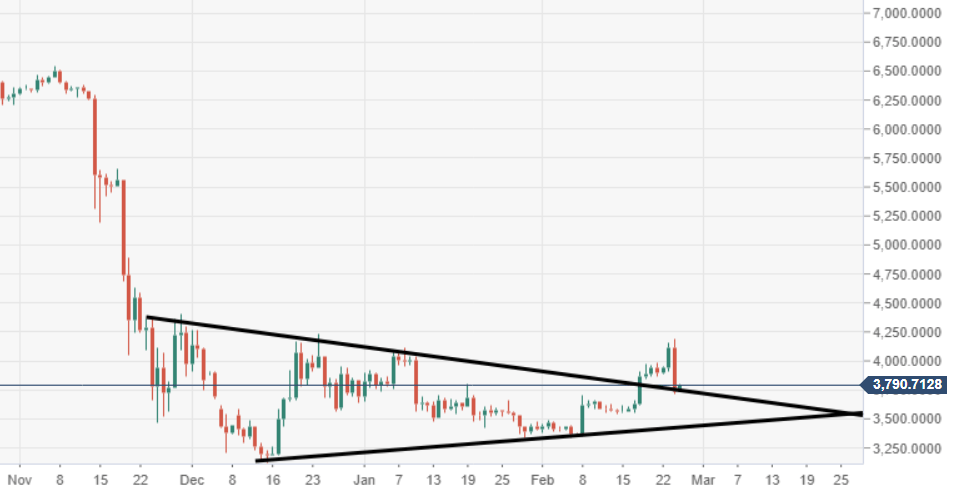
BTC/USD daily chart
- Price action via the daily is sitting on top of a pennant pattern after the bulls managed to escape this a few sessions ago.