- Bitcoin price in the session on Tuesday is trading with losses of some 3.50%.
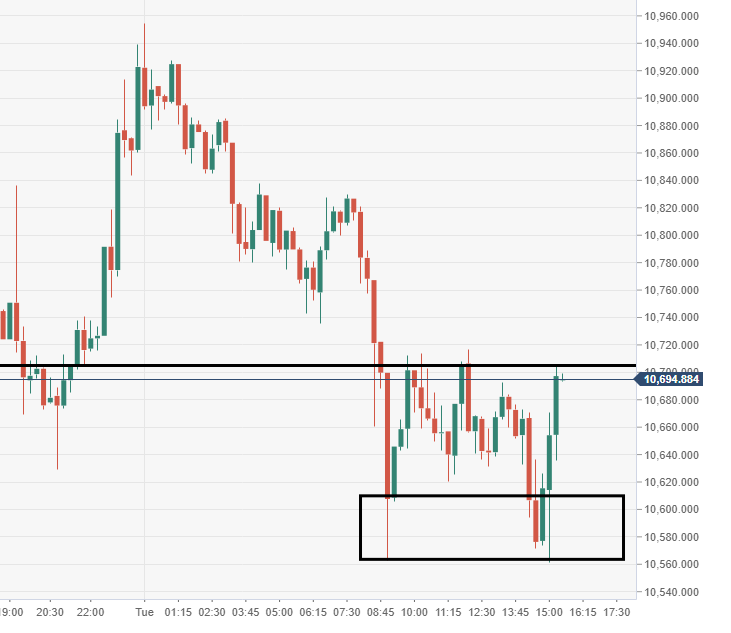
- BTC/USD price action via the near-term view has formed a double bottom, protecting the $10,500 mark.
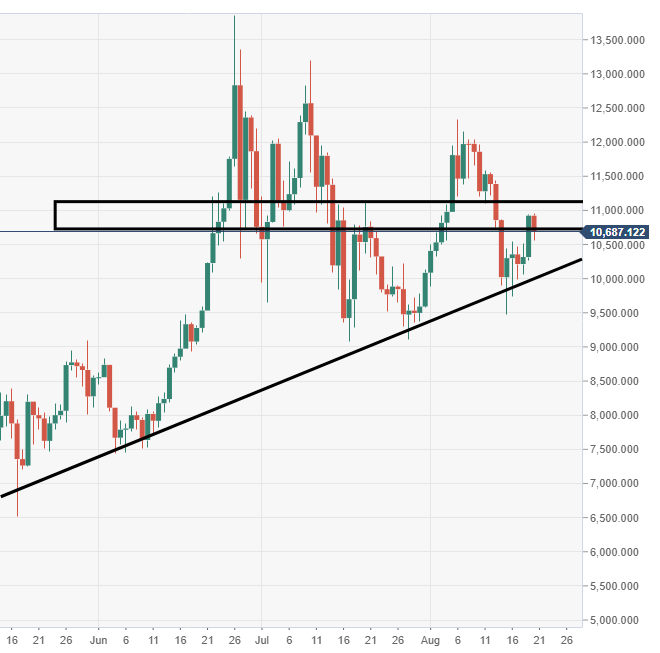
- Key resistance can be observed running from $11,000-11,500, via the daily.
Spot rate: 10,664.23
Relative change: -2.30%
High: 10,954.79
Low: 10,561.66
BTC/USD daily chart
- Sellers remain camped in the range of $11,000-11,500 price range, causing much difficulty.
BTC/USD 15-minute chart
- Near-term buying area protecting price from free-falling below the $10,500 area.