- Bitcoin price trading up on Monday, within gains of over 6%, thanks to a recent spike higher.
- BTC/USD is trading around its highest levels in five sessions.
- Bulls forced a spike of some 7% within just around 1 hour of trading this afternoon London time.
BTC/USD 15-minute chart
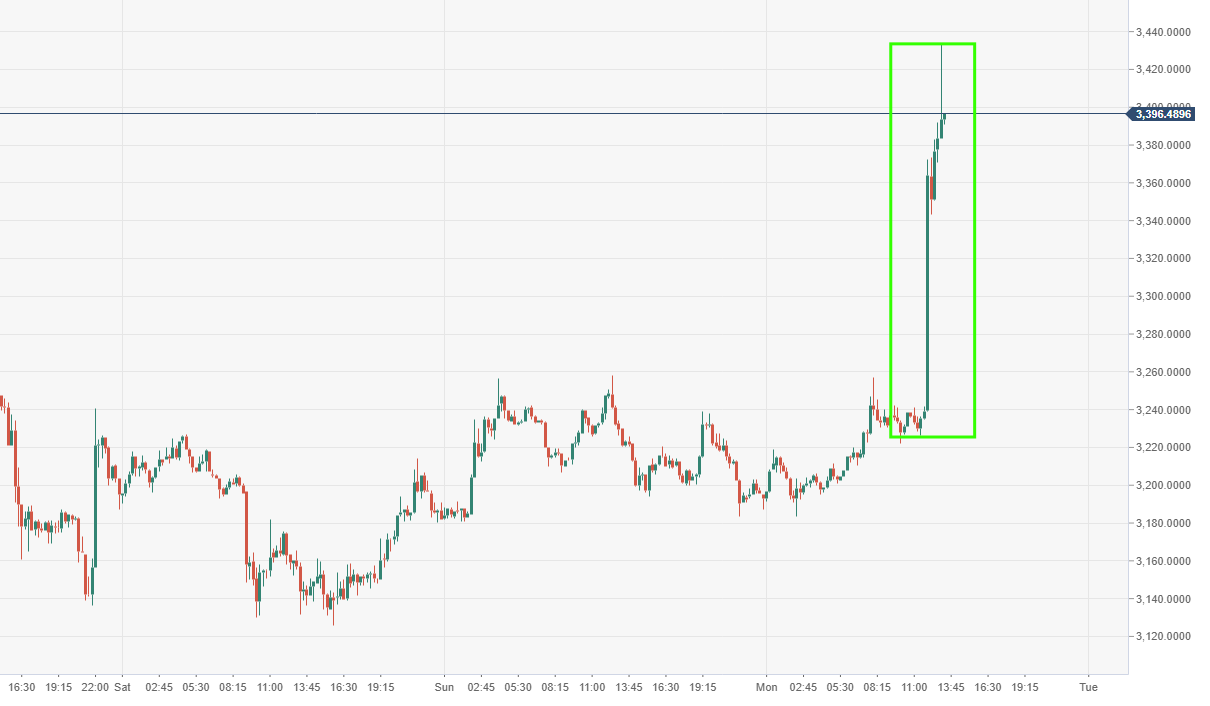
Spot rate: 3395.66
Relative change: +6.80%
High: 3433.98
Low: 3183.38
Trend: Bullish
Resistance 1: 3450.00, near-term supply area.
Resistance 2: 3500.00, psychological resistance.
Resistance 3: 3456.13, 7 December high.
Support 1: 3163.40, daily pivot point support.
Support 2: 3133.59, daily pivot point support.
Support 3: 3086.30, daily pivot point support.
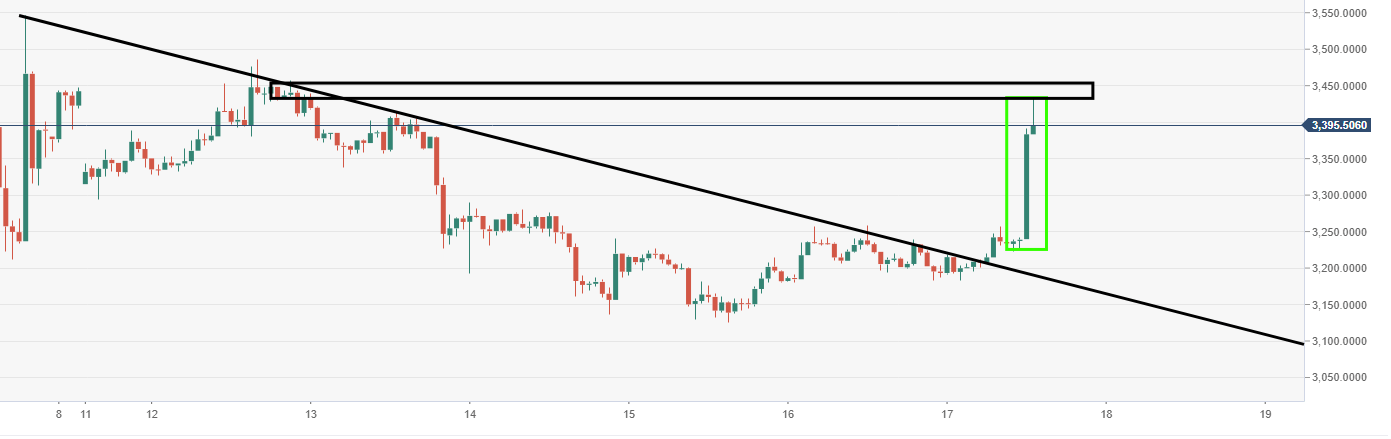
BTC/USD 60-minute chart
- Bulls managed to make a break to the upside from a descending trend line of resistance.
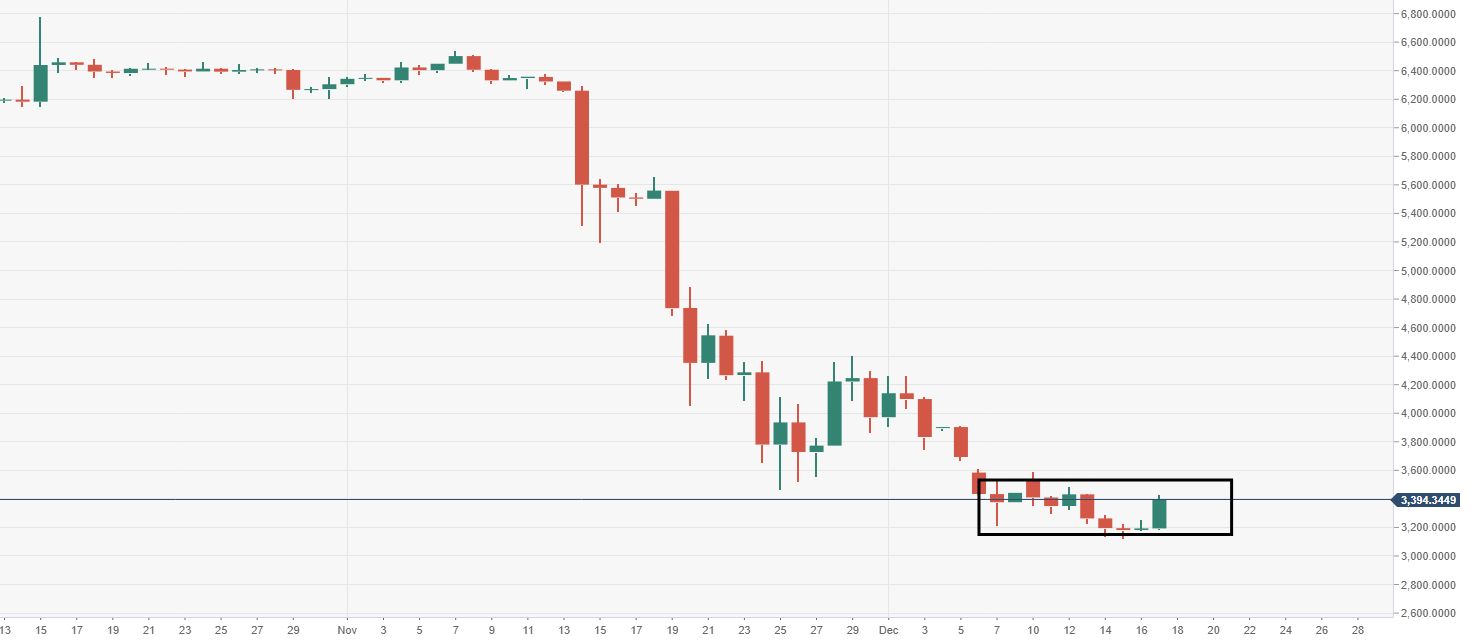
BTC/USD daily chart
- A breakout to the upside is required from the bulls from this recent range-block, for a larger wave of buying pressure.