- Bitcoin price on Thursday is nursing minor losses of just some -0.1% in the second half of the day.
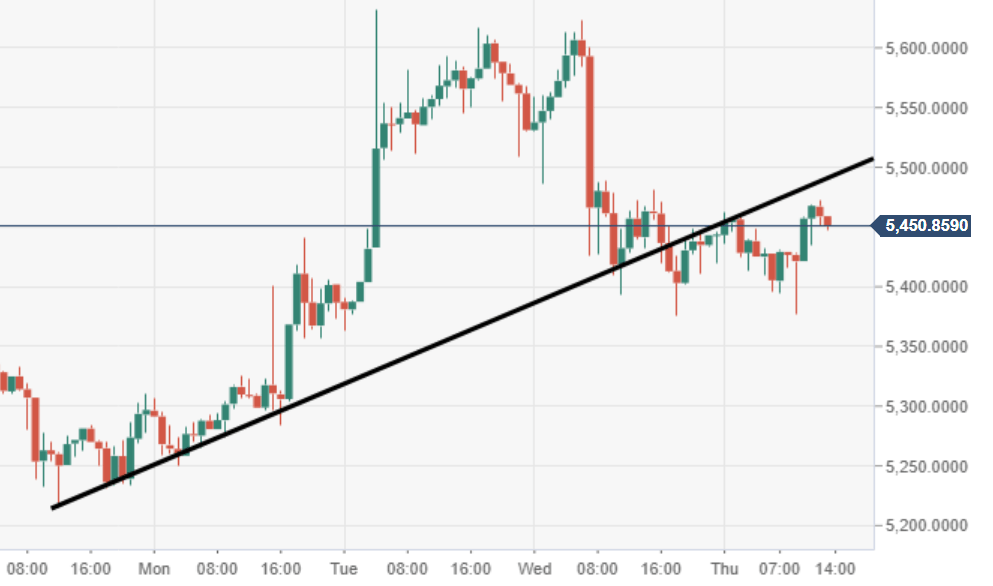
- BTC/USD price is stuck below a breached ascending trend line seen via the 60-minute, a new area of acting resistance.
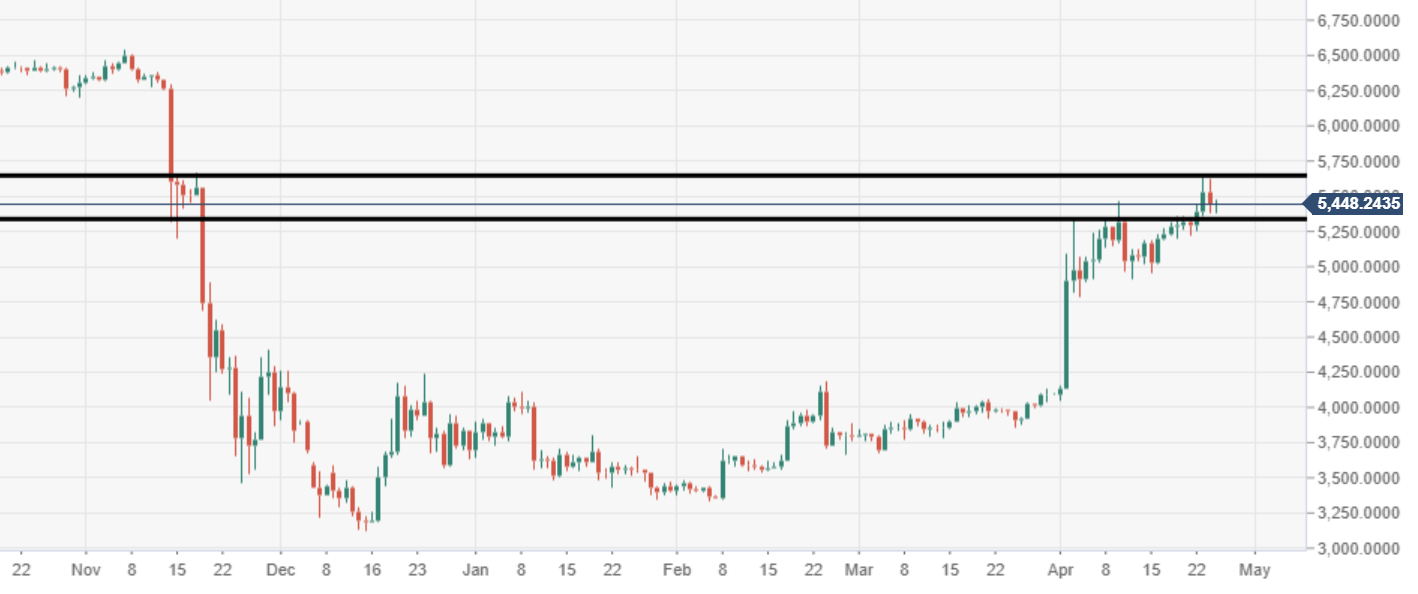
- The price at present is somewhat stuck in the mud, within a big barrier tracking from $5500-600 range.
Spot rate: 5453.00
Relative change: -0.10%
High: 5472.00
Low: 5376.74
BTC/USD 60-minute chart
- BTC/USD via the 60-minute chart view continues to track underneath a breached near-term ascending trend line, to act as new resistance.
BTC/USD daily chart
- Bitcoin price is being forced to slow down given chunky supply barrier running from $5500-5600.