- Bitcoin price is trading marginally in the green, up some 0.55% in the second half of the session.
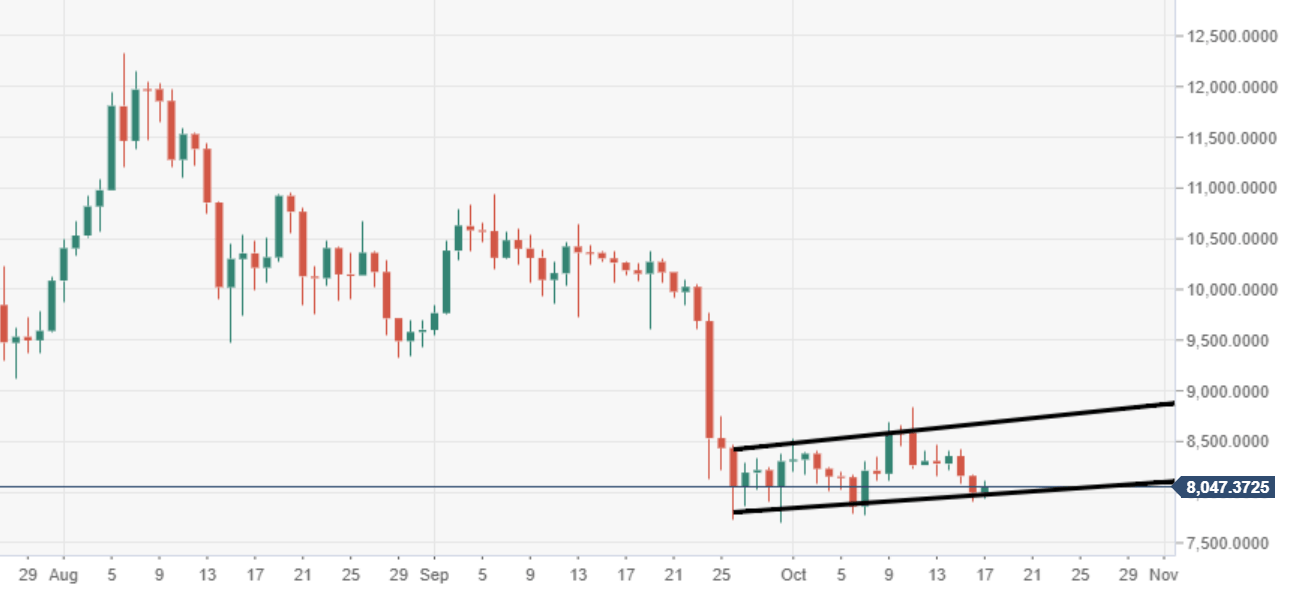
- BTC/USD continues to trade within the confinements of a bearish flag pattern.
- The bears are testing the lower acting support of the above-noted structure.
BTC/USD daily chart
The price has been stuck within the bearish flag for some three weeks now, edging towards a breakout.
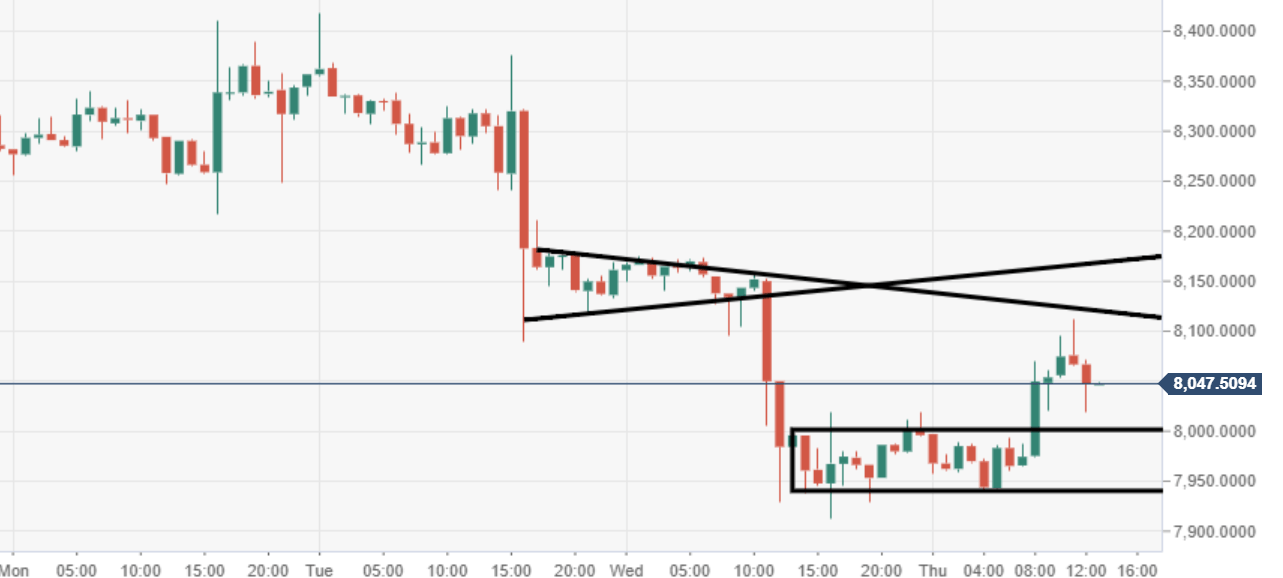
BTC/USD 60-minute chart
BTC/USD has broken out from a near-term range-block formation, which is subject to a retest.
Spot rate: 7,983.91
Relative change: +0.50%
High: 8,112.06
Low: 7,939.99
