Home Bitcoin Technical Analysis: BTC/USD was lifted somewhat above a demand zone, that came to the rescue, price attempting to break down near-term $6850 resistance, 50MA
Crypto News

Bitcoin Technical Analysis: BTC/USD was lifted somewhat above a demand zone, that came to the rescue, price attempting to break down near-term $6850 resistance, 50MA

  • Bitcoin price is still very much stagnant on Tuesday, after the heavy selling pressure over the weekend, down 0.85% on Tuesday.
  • BTC/USD is encountering near-term resistance seen at $6850, 50MA on the 60-minute chart.
  • No clear signs yet for a shift back into the bull’s favour or whether the bears will resume pressure.


BTC/USD 60-minute chart
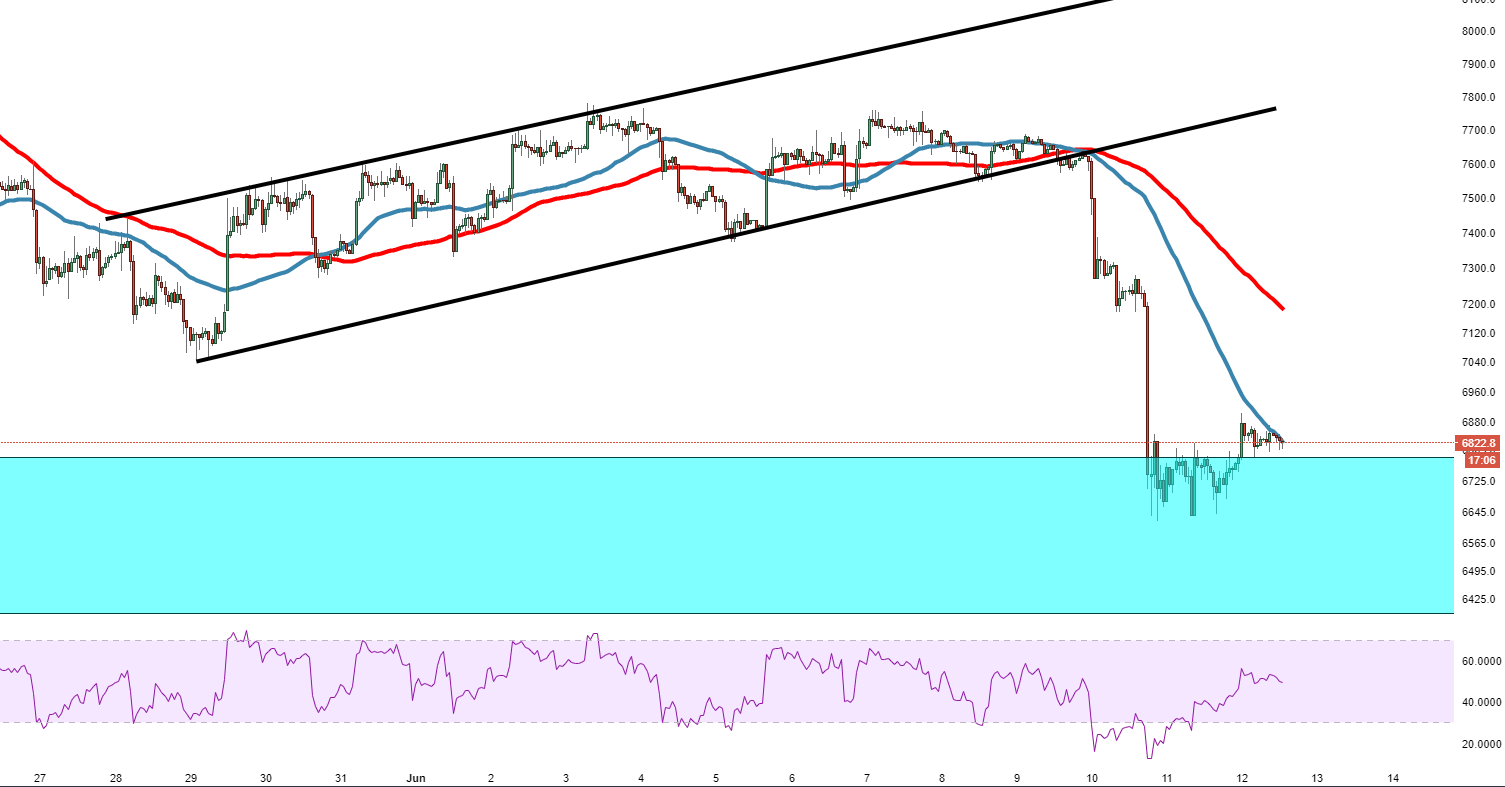
 

Spot rate:                                     6814.50

Relative change:               0.85%

High:                                                     6873.40

Low:                                                       6784.10


Trend:                                                   Bearish


Support 1:                                   6780.00, entry of demand zone.

Support 2:                                     6630.00 (support on 60-minute chart).

Support 3:                                     6430.00, 1st April low.

Resistance 1:                           6850.00 50MA.

Resistance 2:                           7182.50, 100MA.

Resistance 3:                           7735.70, underneath breached ascending channel.


FX Street

FX Street

FXStreet is the leading independent portal dedicated to the Foreign Exchange (Forex) market. It was launched in 2000 and the portal has always been proud of their unyielding commitment to provide objective and unbiased information, to enable their users to take better and more confident decisions.