- Bitcoin price on Monday is back within the control of the bears trading in the red, down some 1.5% in the session.
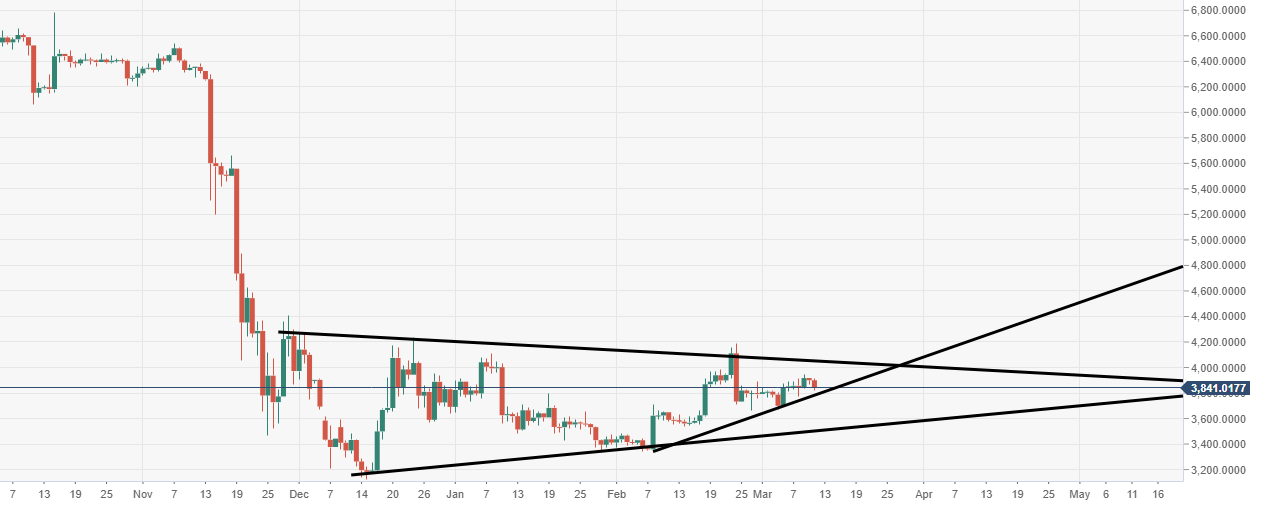
- BTC/USD via the daily time frame continues to move within a bearish pennant structure.
- A near-term ascending trend line preventing the price from coming under hard selling pressure.
Spot rate: 3939.20
Relative change: -1.50%
High: 3911.85
Low: 3816.51
Trends:
Daily SMA20: 3850.48
Daily SMA50: 3652.99
Daily SMA100: 3692.56
Daily SMA200: 4999.09
Levels:
Previous Daily High: 3917.33
Previous Daily Low: 3865.98
Previous Weekly High: 3910.39
Previous Weekly Low: 3672.34
Previous Monthly High: 4187.25
Previous Monthly Low: 3338.98
Daily Fibonacci 38.2%: 3885.6
Daily Fibonacci 61.8%: 3897.72
Daily Pivot Point S1: 3871.54
Daily Pivot Point S2: 3843.09
Daily Pivot Point S3: 3820.19
Daily Pivot Point R1: 3922.89
Daily Pivot Point R2: 3945.79
Daily Pivot Point R3: 3974.24
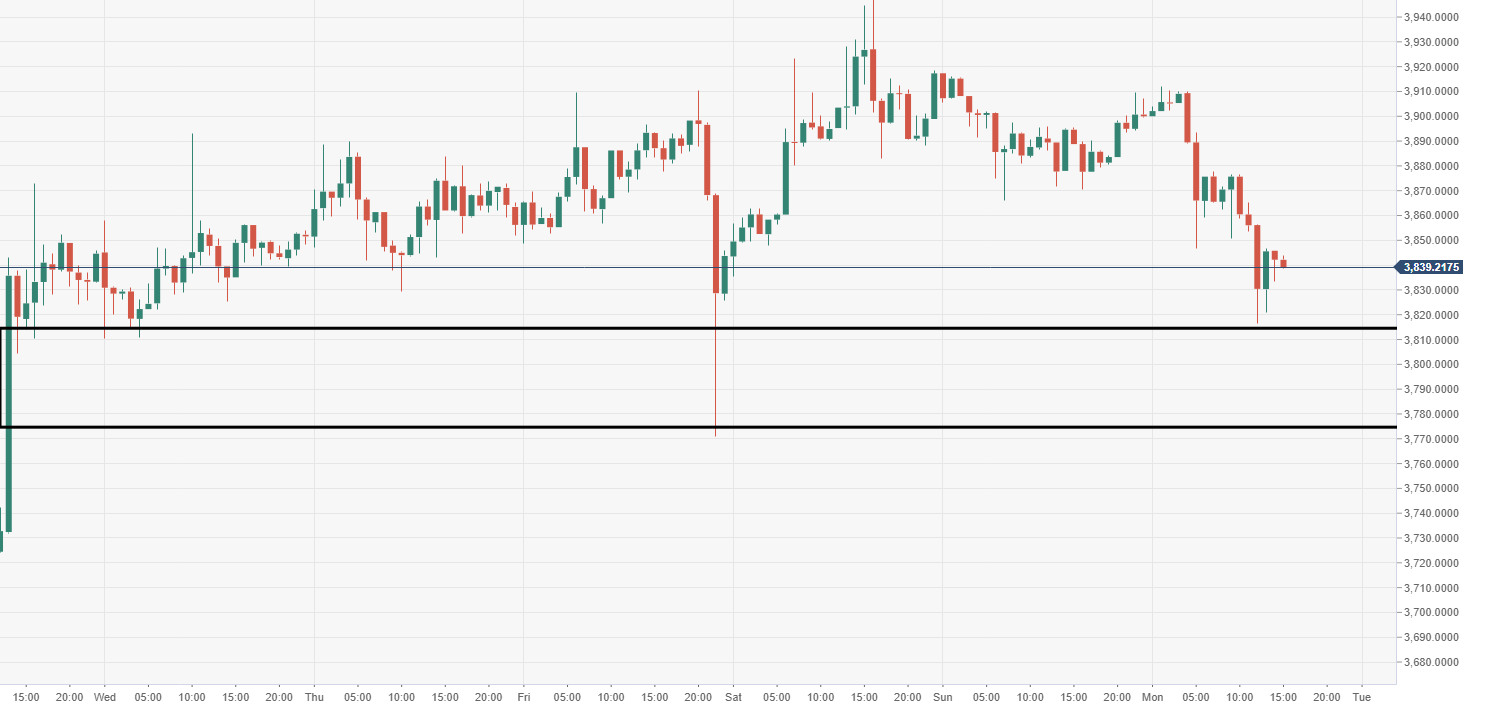
BTC/USD 60-minute chart
- Prominent buying within the range of $3800-700 price area, helping keep price propped up.
BTC/USD daily chart
- A near-term ascending trend line is guiding the price, for now, preventing BTC/USD from dropping to retest the lower part of the pennant.