- Bitcoin price is trading in the red, down marginally by some 1.10% in the second half of the session.
- BTC/USD continues to move within consolidation mode, which has been the case for some five weeks now.
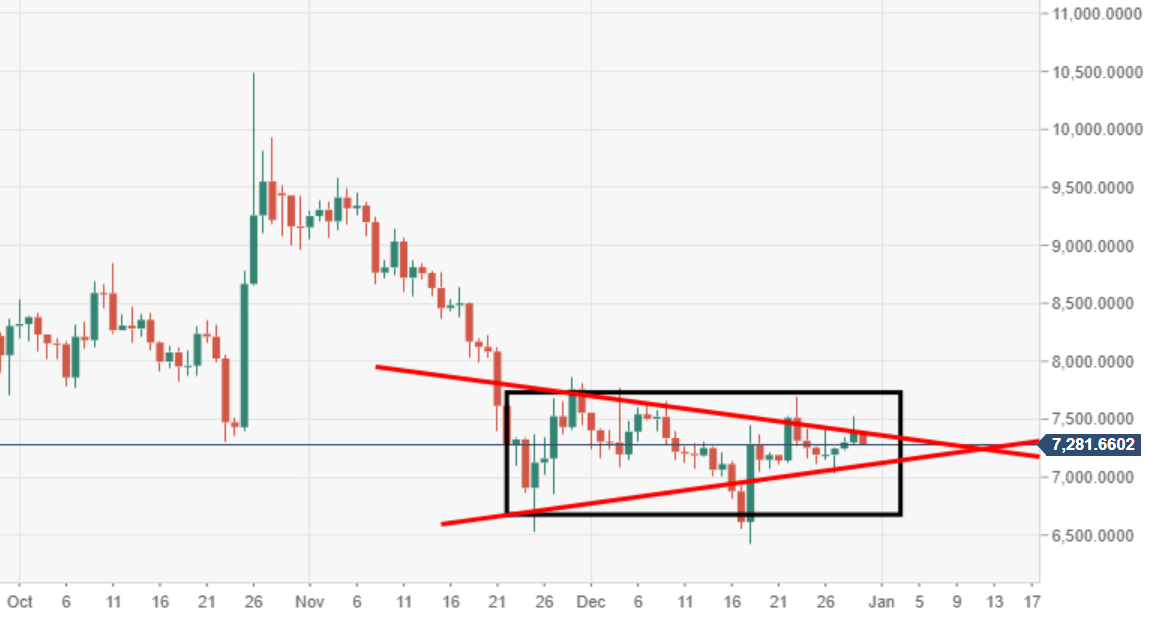
- The price remains vulnerable underneath the $7500 mark, a large barrier.
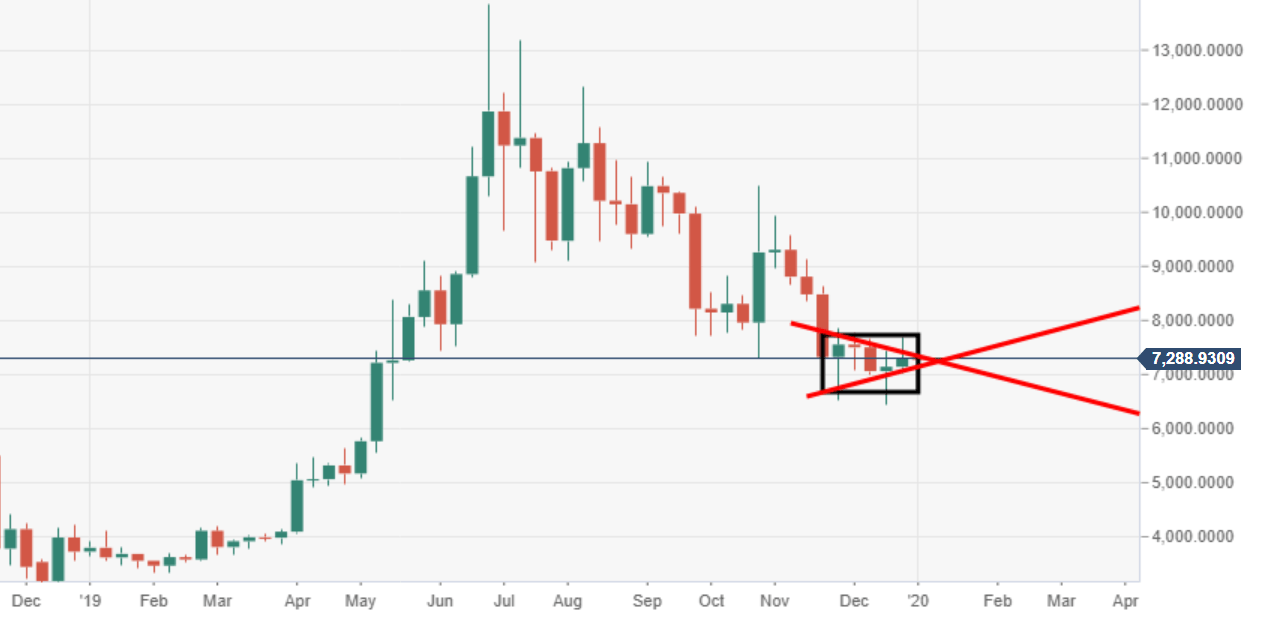
BTC/USD weekly chart
Price action is narrowing within a range-block formation, also viewable as a potential bearish pennant.
BTC/USD daily chart
The current price range is from a high of $7500 down to $6500, as can be seen via the daily. BTC/USD had failed to complete a double bottom technical pattern after sees a rejection at the neckline area, $7500.
Spot rate: 7150.86
Relative change: -1.10%
High: 7386.77
Low: 7271.54
