- Bitcoin price in the second half of Monday is nursing steep losses of some 1.5%, as the price continues to lack any upside momentum.
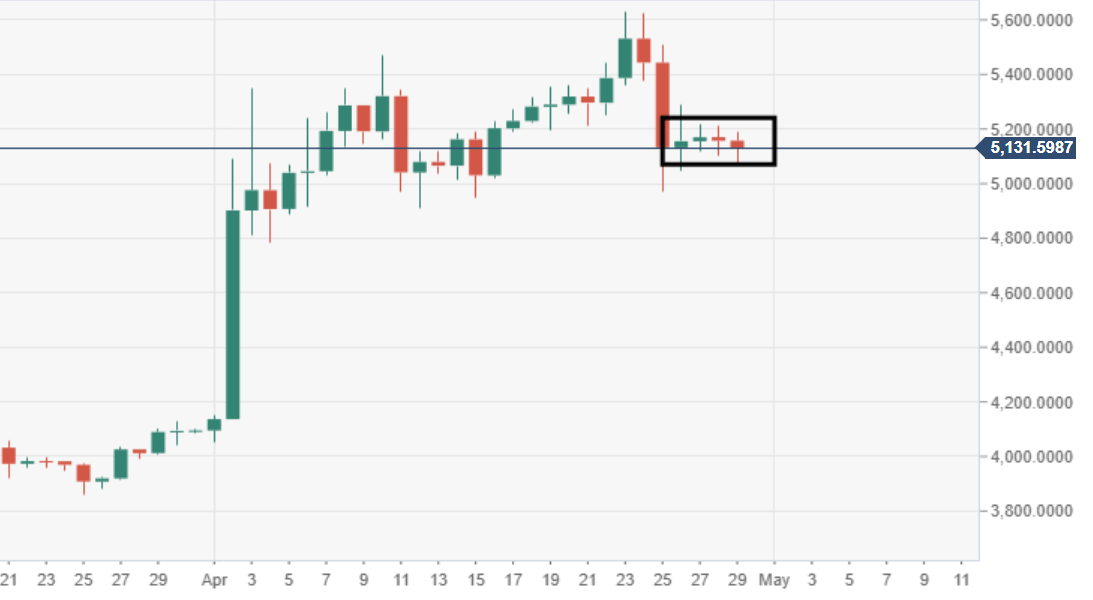
- BTC/USD daily price action is narrowing greatly within a tight range-block, seen over the last four sessions.
- Given the narrowing/consolidation modes after the brutal fall between 24-25th April, vulnerabilities remain tilted to the downside.
Spot rate: 5134.85
Relative change: -1.50%
High: 5189.26
Low: 5073.04
BTC/USD 60-minute chart
- Price action via the 60-minute chart view appears to be a bearish flag pattern, subject to a breakout lower.

BCH/USD daily chart
- Price is running at its fourth consecutive session in negative territory, as the bears maintain control. The bullish pennant structure was not capitalized on by the bulls.