- Bitcoin price was seen down over 1.2% through the mid point of the session on Wednesday.
- Recent price stabilization and behavior suggests of another breakout may be coming.
- The average price prediction from a panel at finder.au of 9 cryptocurrency experts, was seen at $7340 for 1 November.
- BTC/USD price has slipped below the 50MA on the 60-minute chart view.
- Tight price action being observed within a range-block, just over $100 range.
BTC/USD 60-minute chart
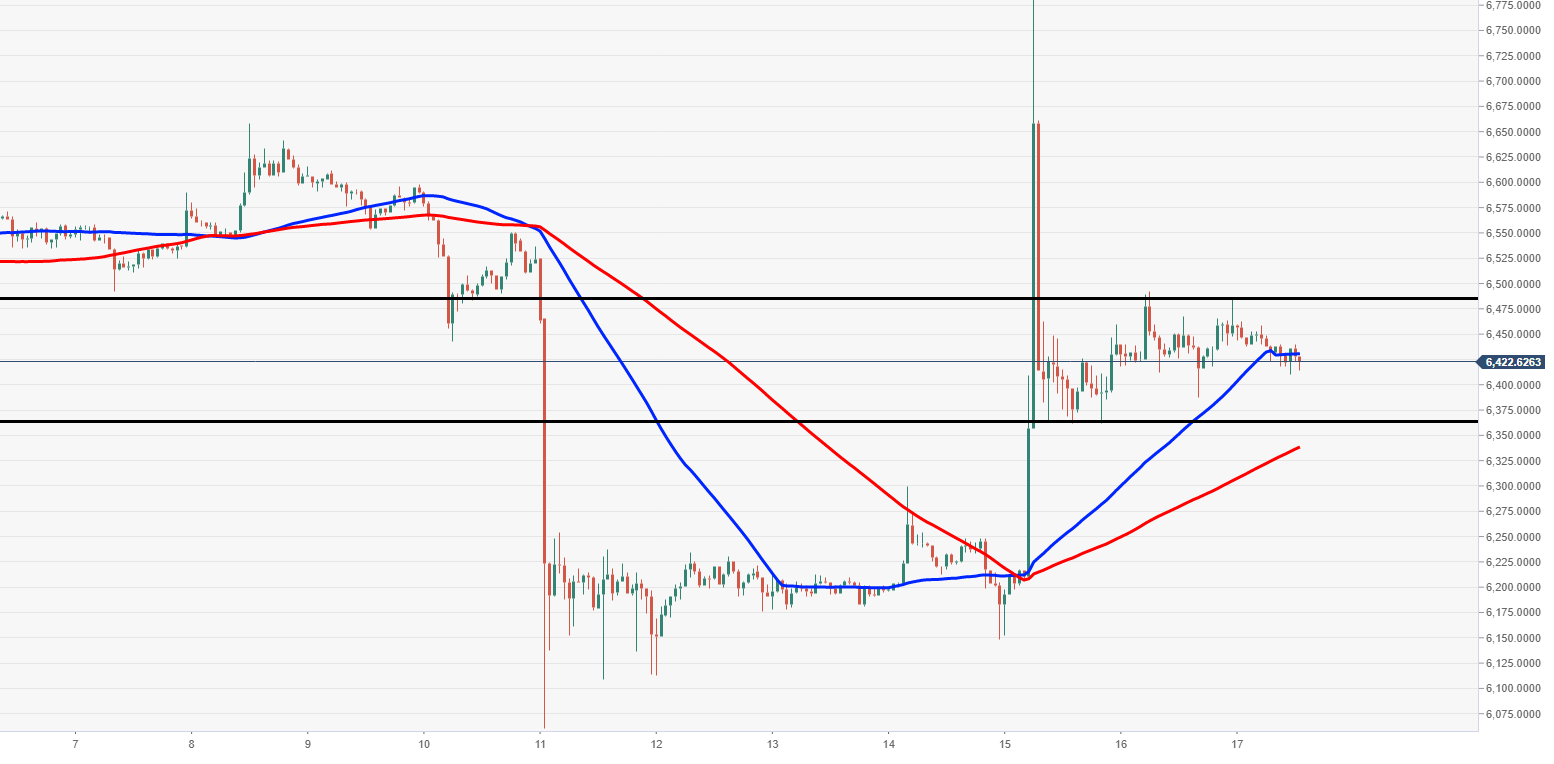
Spot rate: 6517.4
Relative change: -1.25%
High: 6601.2
Low: 6519.0
Trend: Bearish
Support 1: 6420.1, support on 60-minute.
Support 2: 6364.3, demand area.
Support 3: 6110.5, low area 11-12 October.
Resistance 1: 6550.0, resistance on 60-minute chart..
Resistance 2: 6600.0, supply area.
Resistance 3: 6822.5, 22 September high.
