- Bitcoin recovered from the recent low but failed to break $24,000.
- Technical indicators imply that the price is vulnerable to further losses.
Bitcoin (BTC) is hovering at around $23,000. The pioneer digital currency recovered from the recent low of $21,900 and bumped into a brick wall of sell orders on approach to $24,000. A failure to clear the resistance pushed the price back into a red zone.
Sell signals start piling up
From a technical point of view, BTC is vulnerable to decline further. An evening star candlestick formation, a harbinger of a trend reversal, transpired on the 3-day chart. This model usually consists of three candles: a large green candlestick, a Doji or a small-body candle, and a red candle. All three ingredients are in place, meaning that BTC might be in for a deeper decline.
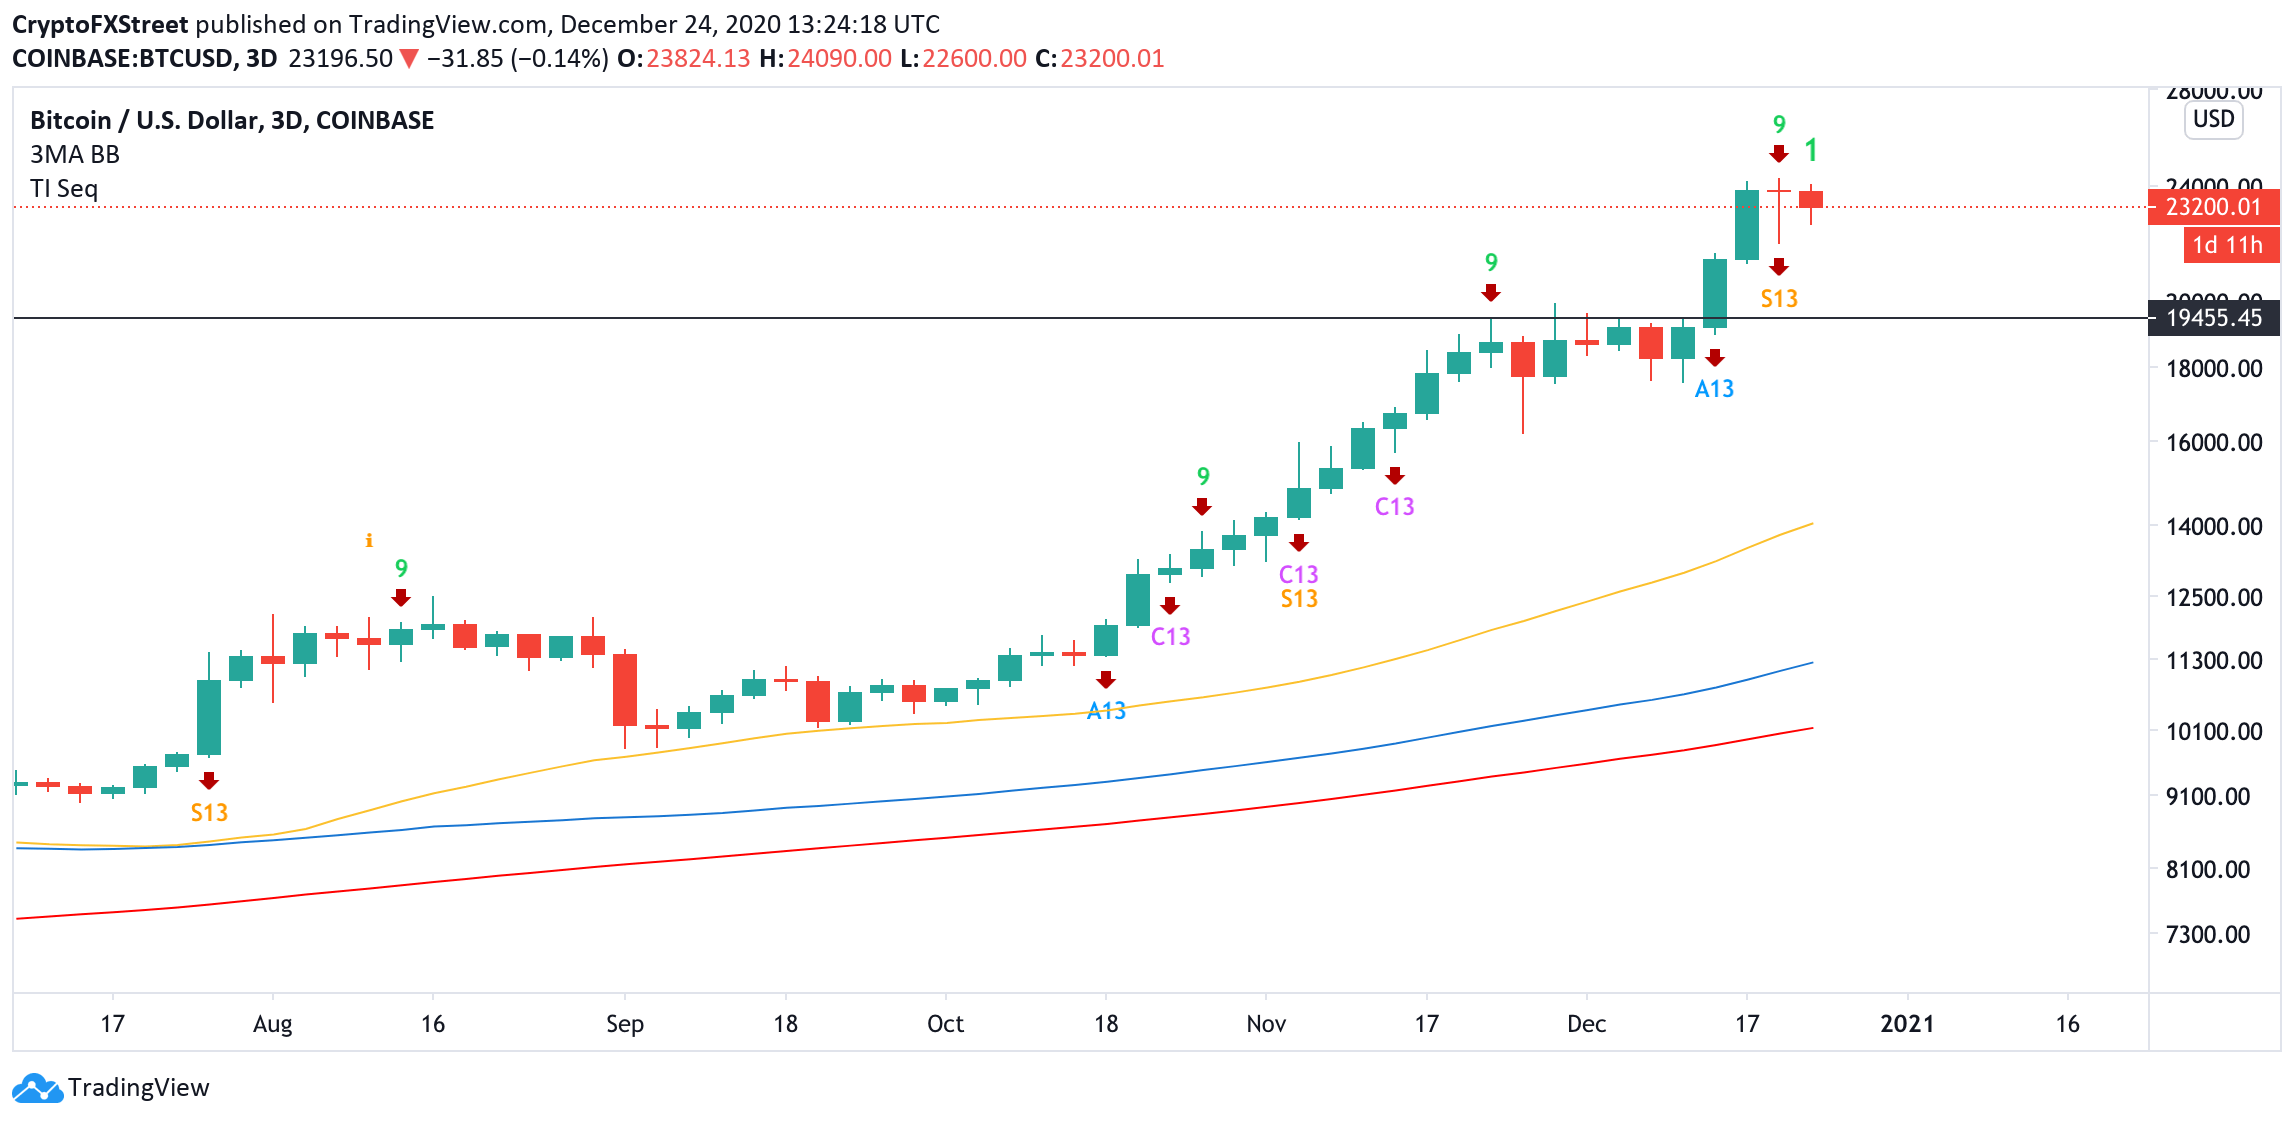
BTC, 3-day chart
Also, the TD Sequential indicator produced a sell signal in the form of a nine green candlestick on the same timeframe. If this pattern is confirmed, BTC may extend the correction towards the local bearish target of $21,800. This barrier is created by 38.2% Fibo retracement weekly and the Pivot Point 1-day Support 1. If it gives way, the sell-off gains traction, BTC may re-test $20,600 (61.8% Fibo retracement weekly) and $19,400. This area served as strong resistance at the beginning of December. Now it can be verified as support.
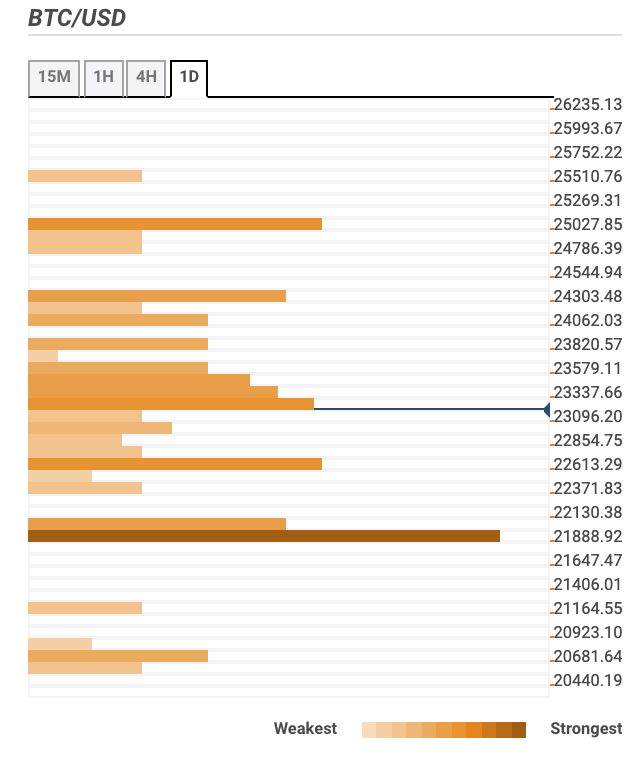
BTC, confluence levels
On the upside, the first local barrier comes at $23,500 in the form of 61.8% Fibo retracement daily, which also coincides with the highest level of the previous four hours. A sustainable move above this area is needed for the upside to gain traction. The next focus is on the psychological $24,000 reinforced by the upper line of the 4-hour Bollinger Band and the Pivot Point 1-day Resistance 1.
BTC whales flee the network
Bitcoin’s Holders’Distribution data shows that over 50 participants holding from 1,000 to 10,000 BTC worth $23 million to $230 million left the network since the beginning of the week. This significant outflow may translate into an increased bearish pressure and lead to a massive BTC sell-off.
%20%5B16.25.10,%2024%20Dec,%202020%5D-637444132095399242.png)
BTC, Holders distribution
The activity of large coin holders, also known as whales, often serves as a leading indicator for the price movements.
