- Bitcoin breaks down on the short term chart.
- Small dip seen in the near term, long term hazy
Bitcoin, the largest cryptocurrency, has broken down of a rising wedge pattern on the short term chart, though its not as scary to warrant a panic among the bulls, who anyway have gone on a long summar vacation after the sell-off seen in the cryptos in the past few weeks.
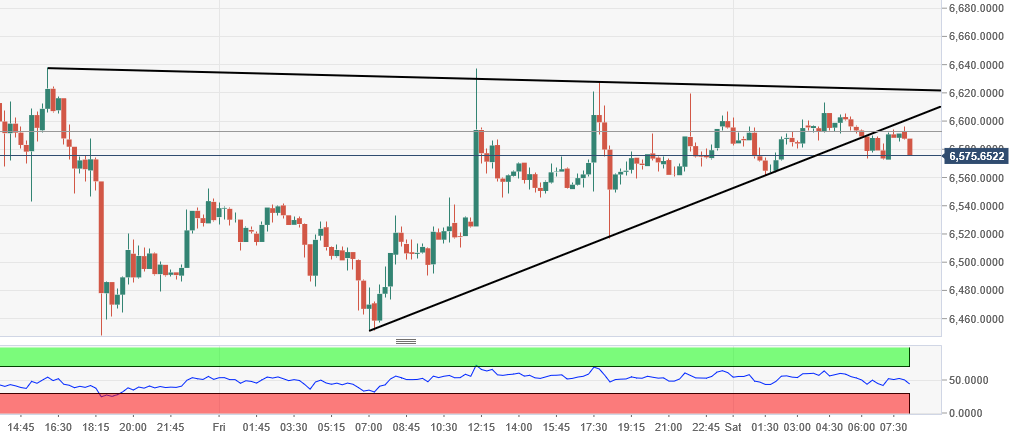
BTC/USD is down about 0.3 percent on day at $6,577.87 and trading in a less than $100 range for the day. On the 15-minute chart, BTC has broken down of a rising wedge which would potentially target around $6,420, not a meaningful breakdown as such.
Immediate resistance for the bulls is placed around $6,600-$6,620 range and if broken on the upside, the move on the downside as a result of rising wedge would be negated for now.
BTC/USD 15-minute chart: