- The bulls divergence of the relative strength index (RSI) seen on the hourly chart indicates Brent oil could have a relook at $72.00 and could possibly rise further to descending 50-hour moving average (MA), currently located at $72.70.
- A break below $71.35 would embolden bears.
Hourly chart
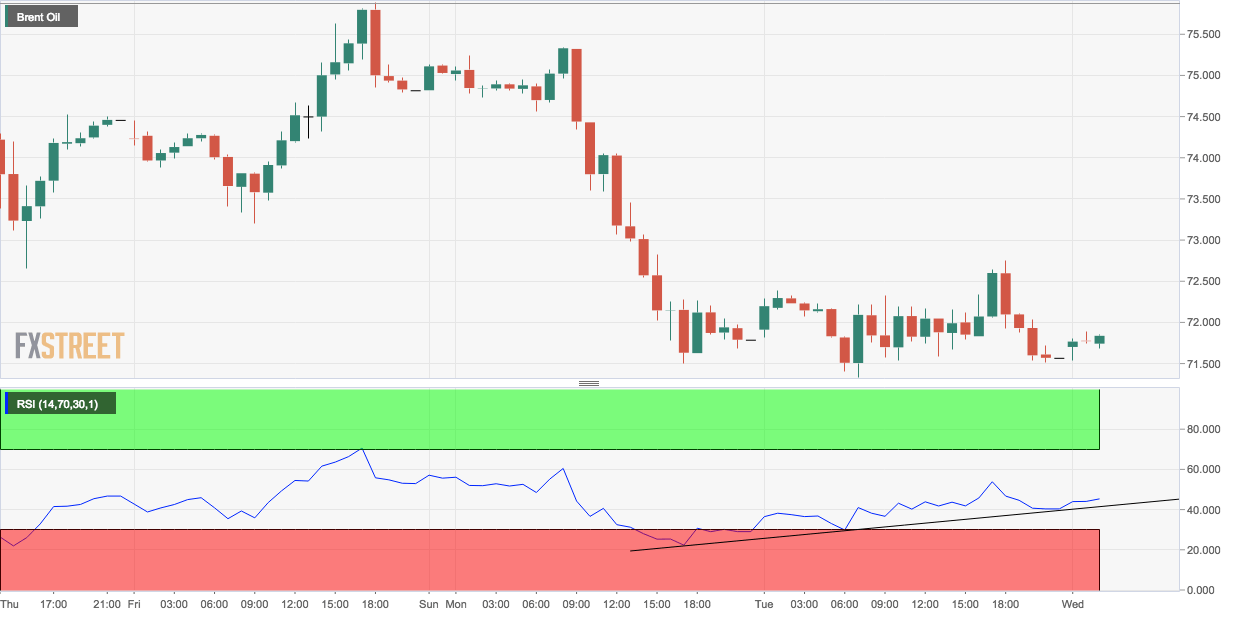
Current Price: $71.80
Daily High: $71.89
Daily Low: $71.57
Trend: Intraday rally likely
R1: $72.00 (psychological hurdle)
R2: $72.70 (50-hour MA)
R3: $73.24 (50-day MA)
Support
S1: $71.35 (previous day’s low)
S2: $70.86 (April 17 low)
S3: $70.00 (psychological level)
