- Brent oil rose to $75.58 yesterday – the highest level since Oct. 31 only to end largely unchanged on the day at $74.30.
- Essentially, Brent created a candle with a long upper wick. Notably, the candlestick has been formed following a solid rally to near 6-month highs. Hence, it could be considered a sign of buyer exhaustion.
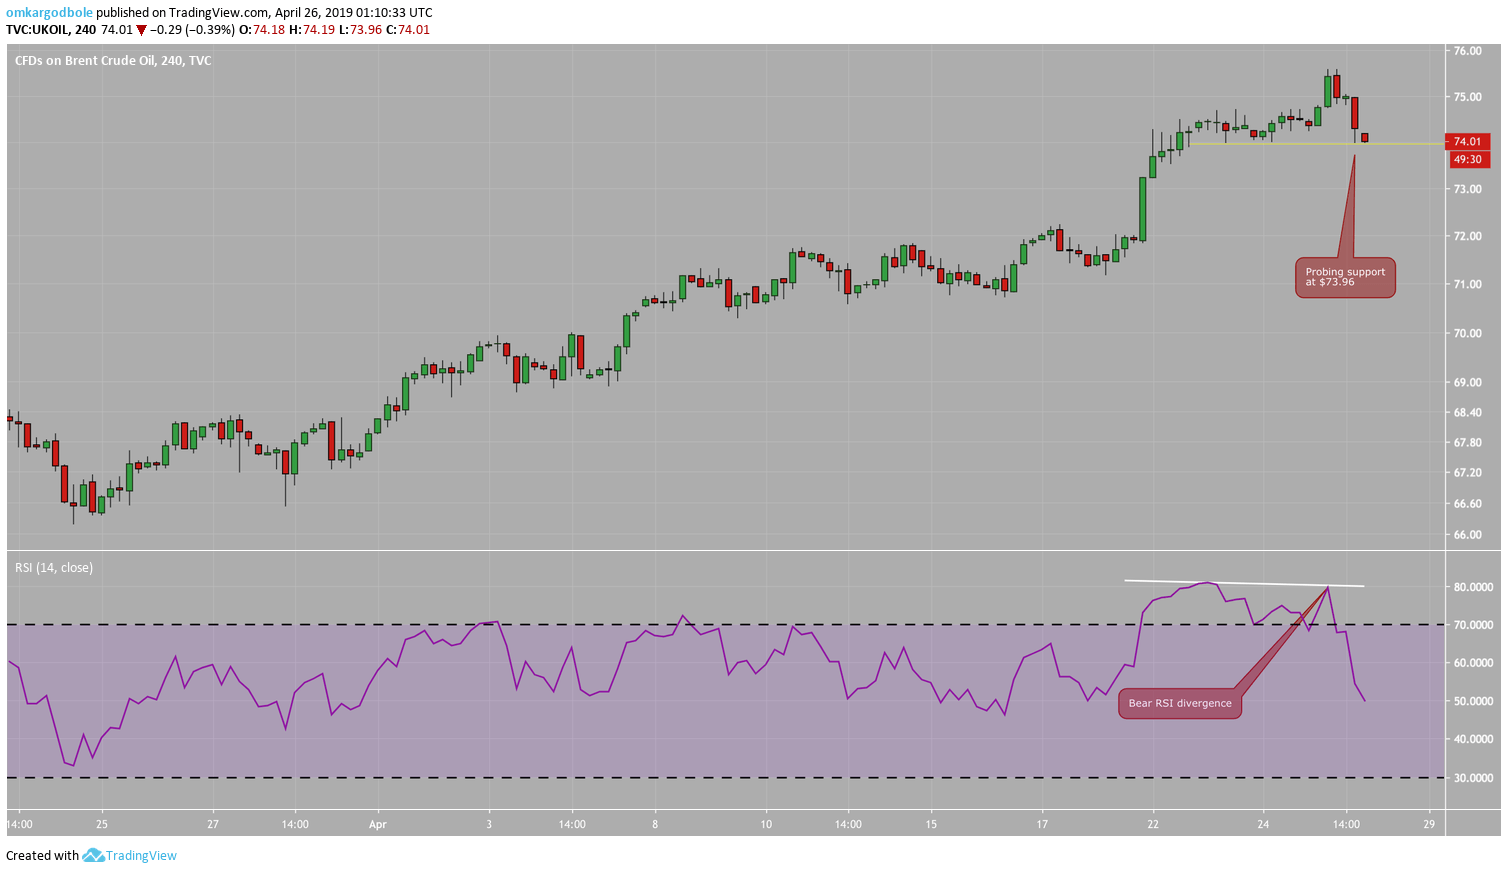
- Further, the relative strength index (RSI) on the 4-hour chart has diverged in favor of the bears.
- So, a deeper pullback could be in the offing. So far, however, the oil benchmark has managed to defend the support at $73.96.
- A break below that level would validate the bull exhaustion signs and open the doors to $70.76 (April 16 low).
Daily chart
-636918380797461489.png)
4-hour chart
Trend: Bearish
Pivot Points
