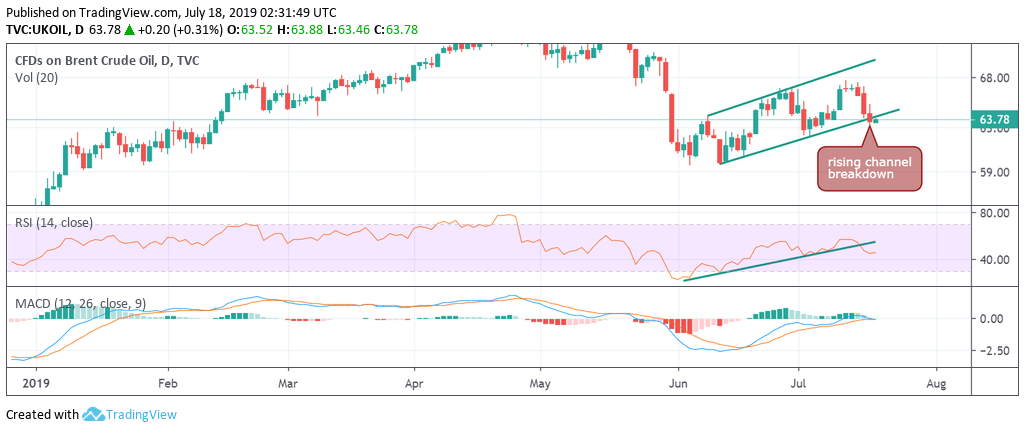
- Brent’s daily chart shows a rising channel breakdown.
- MACD about to turn bearish, RSI below 50.
- Deeper losses toward $62.10 likely.
Brent oil closed 1.21% lower at $63.58 on Wednesday, confirming a downside break of an ascending channel on the daily chart.
The bullish channel breakdown is backed by a below-50 reading on the 14-day relative strength index (RSI) and the bearish crossover of the 5- and 10-day moving averages.
Further, the moving average convergence divergence (MACD) histogram is about to cross below zero. That would further confirm a bearish reversal.
As a result, Brent risks falling to support at $62.10 (July 3 low) in the short-term. As of now, a barrel of Brent is changing hands at $63.86 per barrel.
Note that a positive divergence of the relative strength index is seen on the 4-hour chart. So, prices may rise to levels above $64.00 before resuming the drop toward $62.10.
Daily chart
Trend: Bearish
Pivot points
