- BTC price shows indecision as it could rally to a new all-time high or drop further towards the $40,000 mark.
- Increasing concerns on Bitcoin’s energy consumption would hurt the Bitcoin price.
- The formation of a golden cross on the daily chart shows that Bitcoin could tilt in favour of the bulls and rise higher.
Bitcoin price has been consolidating since the Tuesday September 07 cryptocurrency market flash crash. The good news is that BTC price has shown substantial strength after leaping from recent crashes. The bad news is that there is still uncertainty around the current Bitcoin price action as it is unclear whether the consolidation will transform into a new bullish trend or lead to a deeper decline.
News on Bitcoin’s increasing energy consumption doesn’t help the situation either.
Bitcoin Has Already Consumed More Energy in 2021 Than All of 2020
A Bloomberg report suggests that Bitcoin has already consumed more power so far in 2021 than it did the whole of 2020.
The Bitcoin network was estimated to consume about 67TWh (terawatt-hours or one trillion watts per hour) of electricity in 2020 and its total consumption so far this year has already surpassed this. It is estimated that by the end of 2021, the Bitcoin network would have consumed 91TW/h – as much power consumption as that of Pakistan.
According to the Cambridge Bitcoin Electricity Consumption Index, BTC is set to consume an even greater energy, 95.68 TW/h by the end of the year – as much power consumption as that of the Philippines.
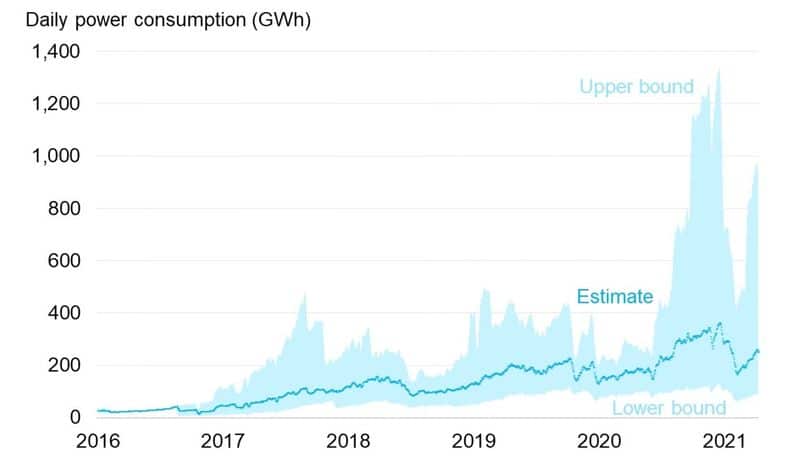
Although the precise energy consumption figures are variable and are not easy to accurately calculate, the trend is clear that Bitcoin’s energy consumption is increasing. The Bloomberg report notes that:
“As the price of Bitcoin increases, more miners with less energy-efficient machines join the network, driving up energy use. This means that it is essential to improve the efficiency of crypto-mining and move to low-carbon energy sources for electricity.”
However, depending on your point of view, it is argued that Bitcoin’s energy consumption is negligible within the context of the overall global electricity consumption. According to Cambridge University data, Bitcoin mining electricity consumption in only 0.43% of this, way less than the estimated 104 TW/h used by the refrigerators in the US alone.
While we cannot deny that Bitcoin mining consumed a great amount of energy, more of it is renewable as new and relocated farms and factories come online in the U.S. and Canada powered by green energy following the great miner migration out of China.
BTC Price Faces Market Indecision
Since September 08, the BTC price has been hovering between $44,305 and $47,495. During yesterday’s bullish session that saw Bitcoin close the day above the 200-day Simple Moving Average, the flagship cryptocurrency appears to be breaking out of this indecision. However, today’s doji stick is an indication that Bitcoin’s market indecision still lingers and investors have to watch key levels before making any decisive moves. The horizontal movement of the Relative Strength Index (RSI) at 52.96 accentuates BTC’s sideways price action
Overall, Bitcoin price prediction is bullish as shown on the daily chart. At the time of writing, Bitcoin teeters around $47,174 on most crypto trading platforms and appears to be battling immediate resistance around the $$47,800 mark.
If Bitcoin price favours the bulls and closes the day above the immediate resistance at $47,800, the BTC/USD price will move upwards to tag $49,203 resistance. A clear breakout above this level would see BTC/USD price tag the $50,000 level or the pre-crash prices above $52,000.
BTC/USD Daily Chart
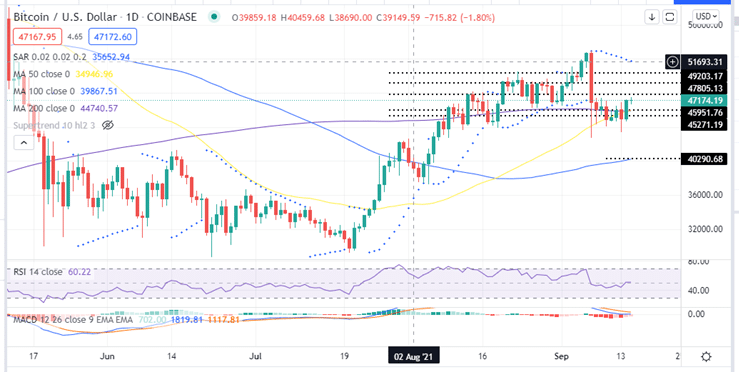
Note that Seller congestion around the $52,900 resistance zone is likely to curtail any further upward movement of BTC. But if the bullish momentum is strong enough to overcome this hurdle, Bitcoin could rally to tag the $60,000 psychological level or the all-time high (ATH) above the $64,000.
Technical indicators on the daily chart accentuate this bullish outlook . For example, the upsloping moving averages and the positive parabolic SAR is an indication that Bitcoin is still bullish.
In addition, the position of the Moving Average Convergence Divergence (MACD) indicator in the positive region above the zero-line points to a bullish marker sentiment. Also note that the MACD has just sent a call to buy signal on the 12-hour timeframe. This happened when the MACD line above the signal line , an indication that BTC price is bullish in the near-term
Along with this, Bitcoin investors have been watching out for the formation of a golden cross on the BTC/USD daily chart. This happened earlier today when the 50-day SMA crossed above the 200-day SMA, an indication that the Bitcoin is tilting in favor of the bulls.
On the flipside, if BTC price favors the bears, it will mean that the sellers are aggressively ensuring that Bitcoin moves further below the $48,000 mark. Therefore, a daily closure below the immediate support at $45,954 where the 50-day and 200-day SMA appear to coincide could see the bellwether cryptocurrency tag the $45,271 support zone. A break below this point could tilt the advantage in favour of the sellers which could see Bitcoin tank towards the $40,290 level embraced by the 100-day SMA.
Looking to buy or trade Bitcoin now? Invest at eToro!
Capital at risk
