- BTC/USD technical analysis shows that the market has been taken over by the bears
- Critical $3,345 support line to be tested soon.
BTC/USD technical analysis shows that the market is heading towards a bearish breakout. The bulls will need to rally and defend the $3,345 support line.
BTC/USD daily chart
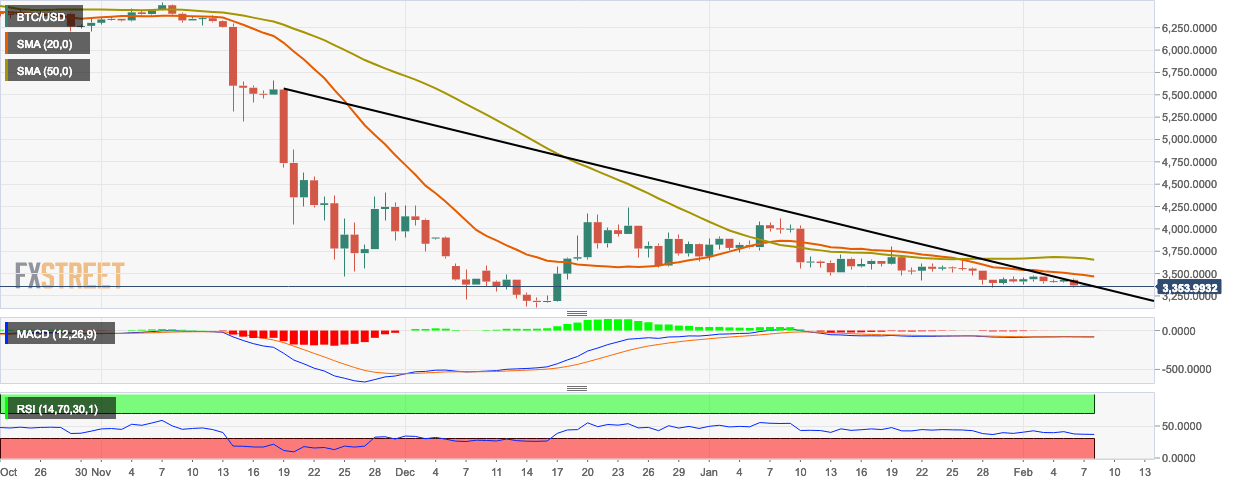
- 20-day simple moving average (SMA 20) and SMA 50 are trending above the market indicating bearish behavior.
- SMA 20 got crossed over by SMA 50 which is a sell sign.
- Relative strength index (RSI) creeping towards oversold territory.
- Bulls need to break past resistance provided by the downward trending line in the short-term.
BTC/USD 4-hour chart
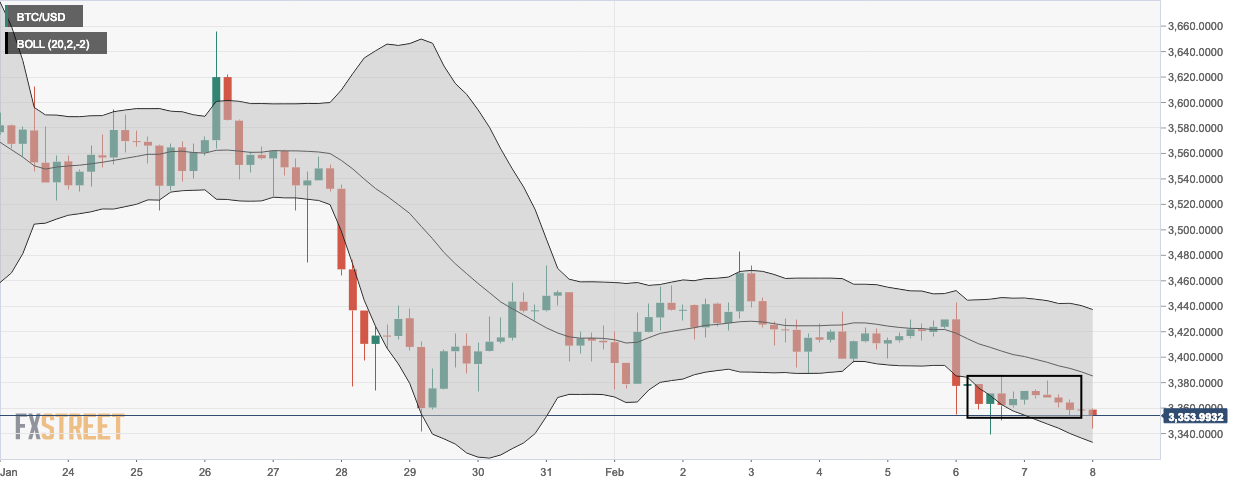
- Bearish flag formation with a bearish breakout.
- The last few sessions are floating a little above the lower curve of the 20-day Bollinger band which indicates that the bulls are trying to fight back.
BTC/USD hourly chart
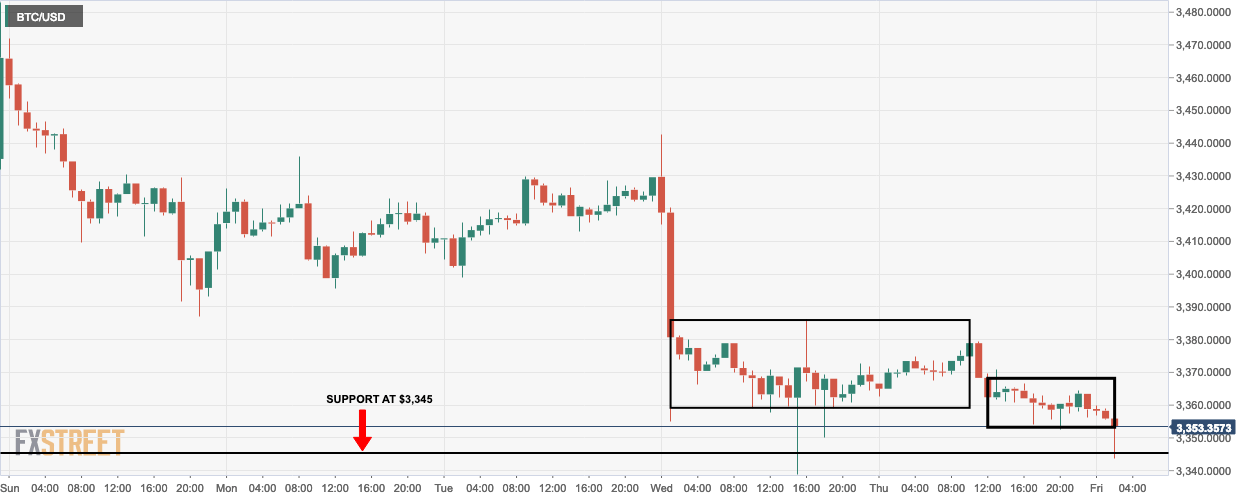
- Multiple bearish flags are present throughout the chart.
- Bulls need to fight and defend the $3,345 support line.
Key Levels
- Resistance 3: $3,405.16
- Resistance 2: $3,393.36
- Resistance 1: $3,376.09
- Pivot Point: $3,364.30
- Support 1: $3,347.03
- Support 2: $3,335.24
- Support 3: $3,317.97
