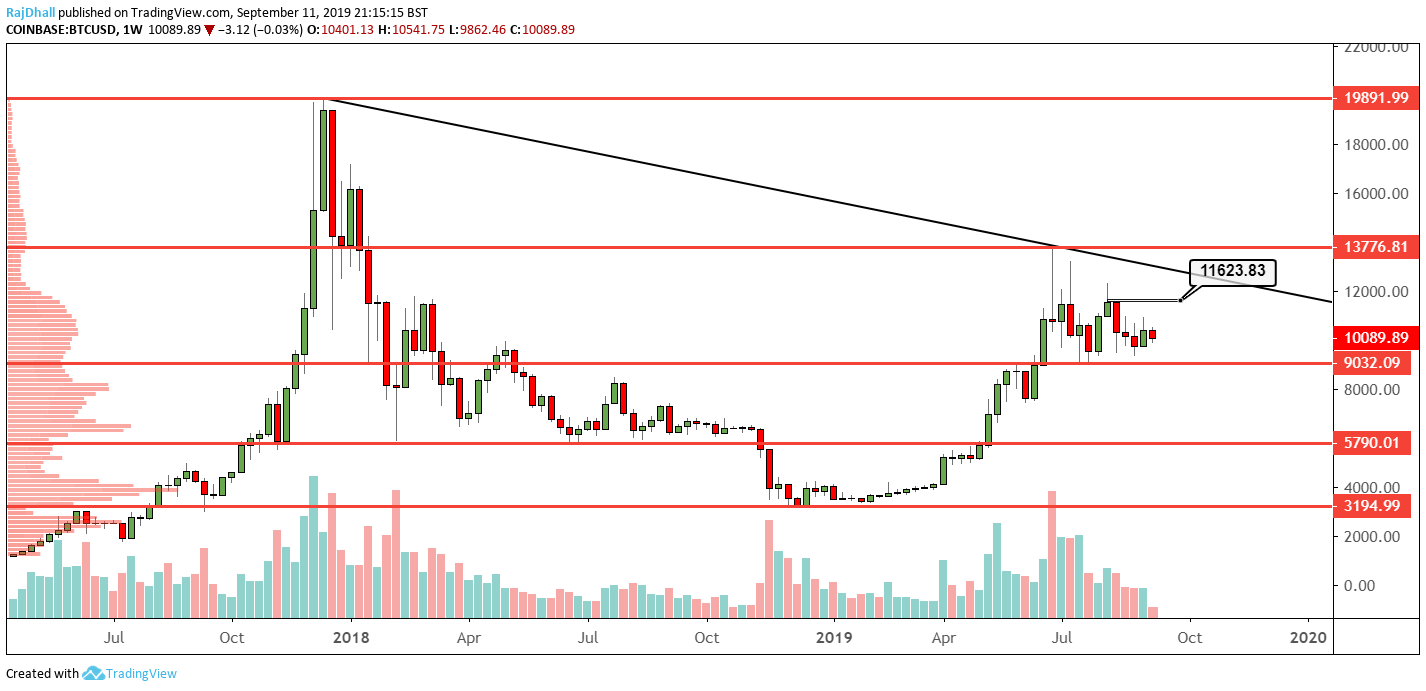
Weekly Chart
Since to 2017 high price has moved back to test the 61.8% retracement from 19,891.99 to 3,194.99.
The 2019 bull run has pulled price back to just above 10k today after the June high of 13,776.81 was rejected.
Over the last couple of weeks, the volatility and volume has become thin. I get the sense we are gearing up for a big move.
Price has made a lower high and only a break of 9,032.09 would confirm a move lower.
The candle close from last week is indicating more of an upside move is on the cards but the shadows (wicks) are making me confused as it was such a big rejection.
On the upside, 11,623.83 marked by the price label is the level to break.
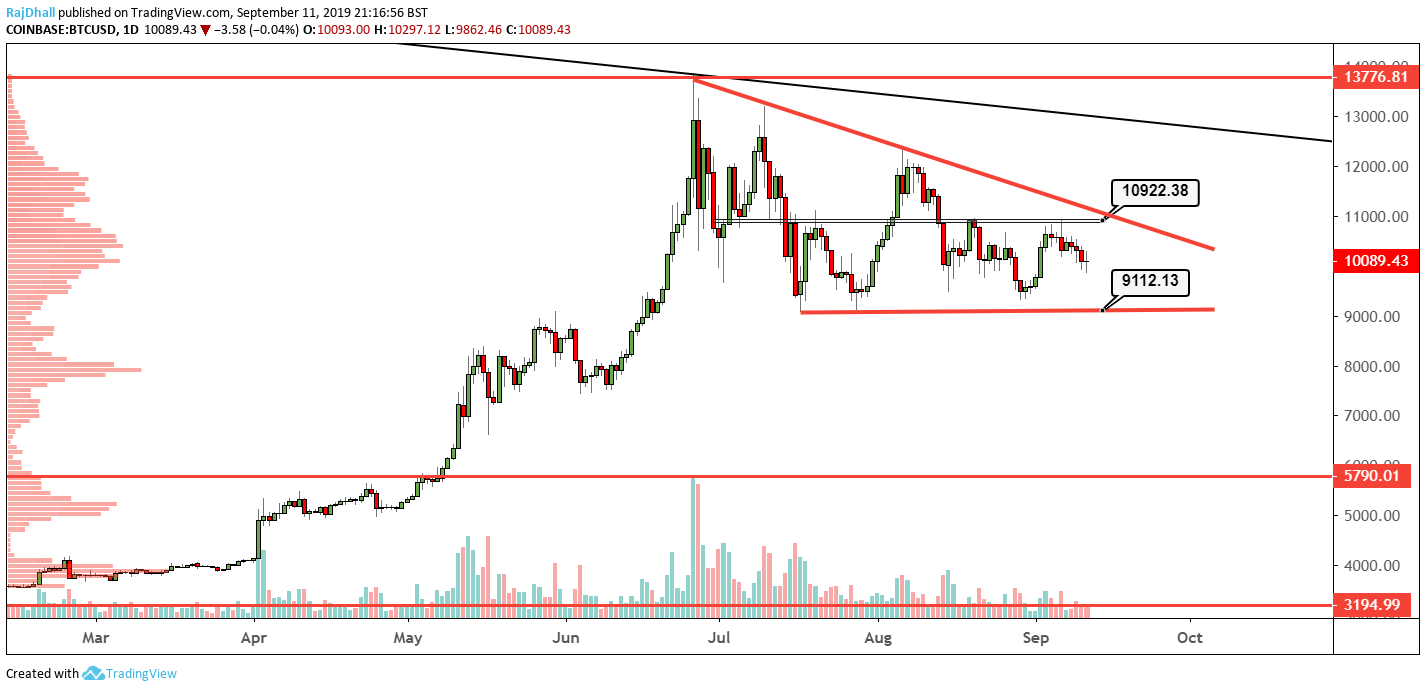
Daily Chart
The daily chart is showing a large descending triangle structure.
This matches up with the weekly chart outlook but the levels have been revised somewhat.
On the downside, the support of 9,112.13 is the key zone. If this breaks it could open up a move to 5,790.01 the next major support.
The upside targets are 10,922.38 and that would help push to the 11,623.83 target mentioned above.
The issue is that at the moment we are in a period of lower highs and lower lows. The market has rejected 11k twice but over the last two sessions 10k is holding firm.
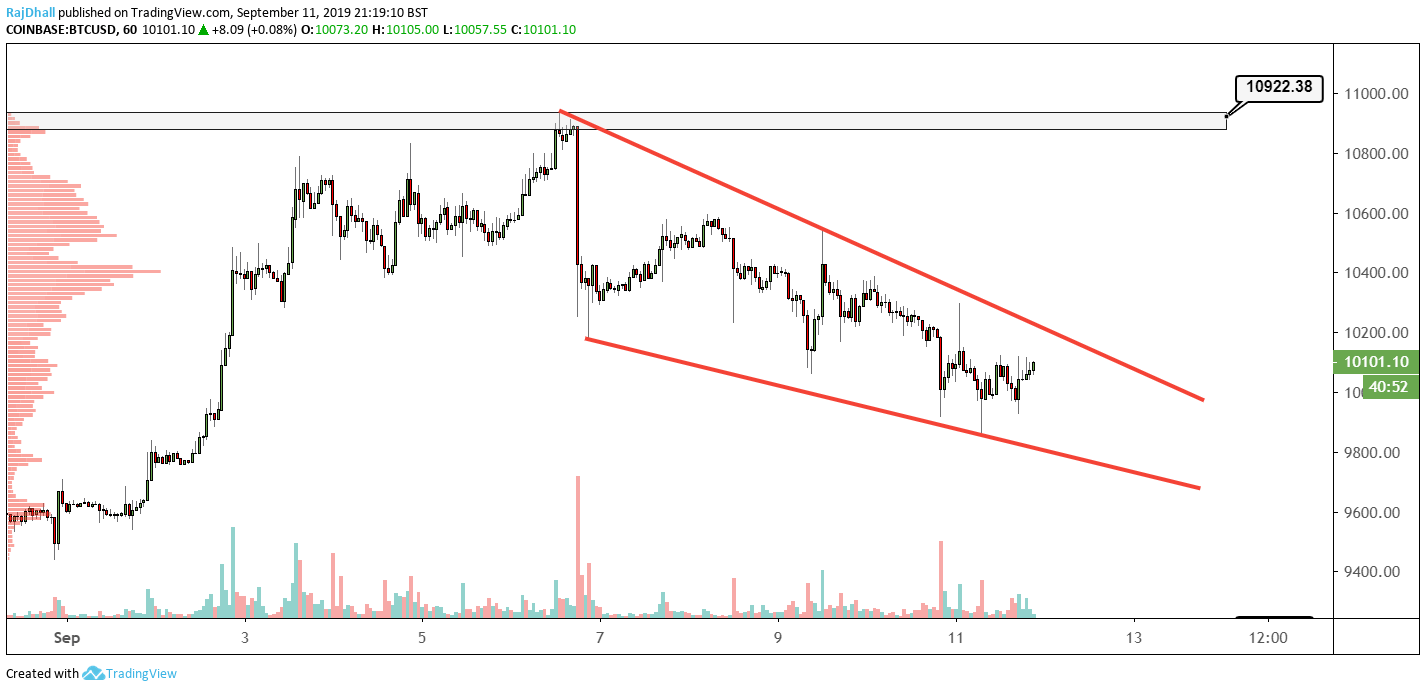
Hourly Chart
This is the simplest chart to analyse, at the moment price has formed a descending wedge formation.
A clear break of the formation with decent volume is needed and 10,391.00 is the next resistance.
That is the area price consolidated after the rally up to 10,939.34.
A break lower could send the price down to the 9,112.13 support level from the daily chart.
In the short term price has rejected a move below 10k three times so a move up could be on the cards.