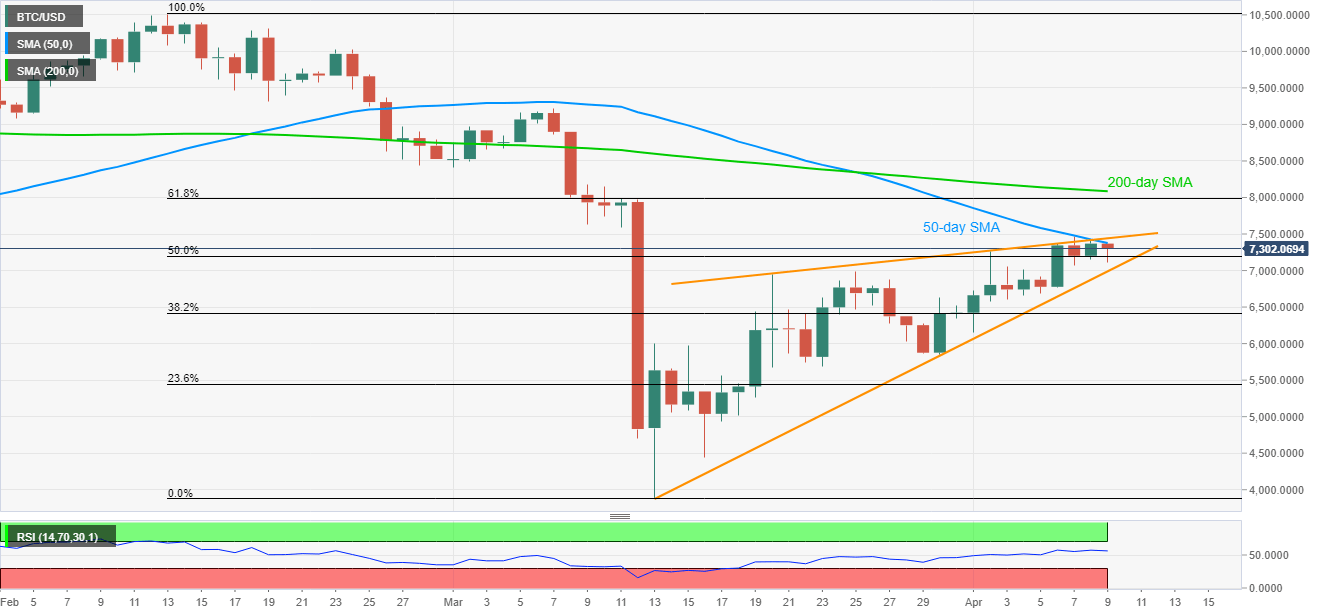
- BTC/USD drops from near-term key SMA, but still left to confirm the bearish technical chart pattern.
- 61.8% Fibonacci retracement and 200-day SMA adds to the upside barriers.
While stepping back from 50-day SMA, BTC/USD takes rounds to 7,305 amid early Friday. Even so, the crypto leader stays inside the rising wedge bearish technical formation.
Hence, sellers will wait for the confirmation of the bearish technical pattern before taking entries.
In doing so, the formation support around 6990 could offer the trigger to the downside towards 5,700 and 23.6% Fibonacci retracement of February-March fall near 5,440.
During the quote’s further drop below 5,440, the 5,000 psychological magnet, 4,900 and 4,000 round-figure can offer intermediate stops to the previous month low close to 3,890.
Meanwhile, a 50-day SMA level of 7,380 and the pattern’s resistance line, around 7,445/50 could keep the pair’s near-term advances in check, a break of which could push buyers in direction to 61.8% Fibonacci retracement level of 7,985 and 8,000 resistances.
If at all the bulls manage to dominate past-8,000, 200-day SMA level near 8,085 could question their strength ahead of recalling the previous month high surrounding 9,215.
BTC/USD daily chart
Trend: Pullback expected
