BTC/USD daily chart
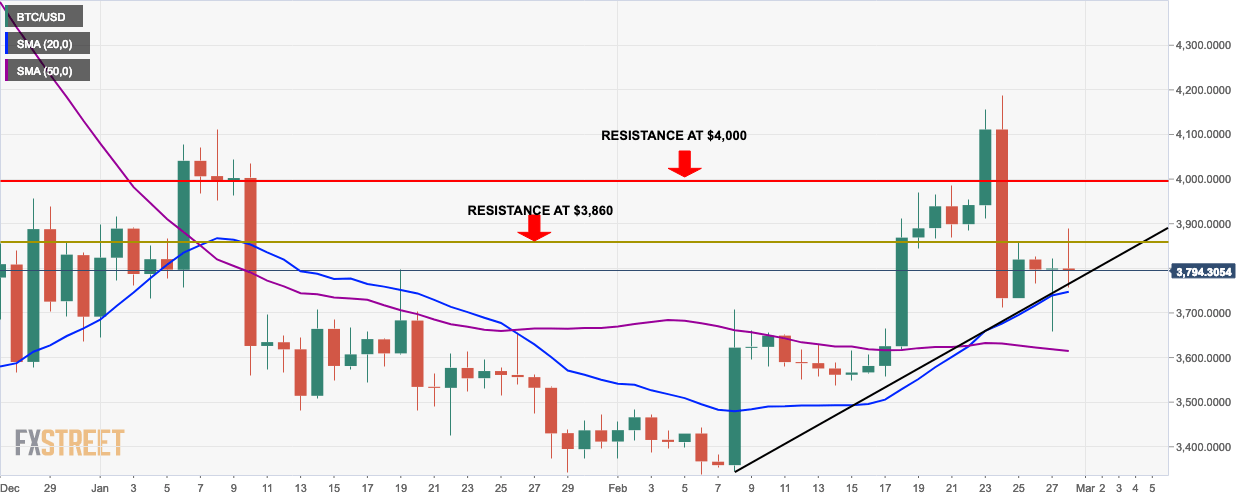
- BTC/USD daily chart forms a triangle and is ready for a breakout.
- The 20-day simple moving average (SMA 20) curve has crossed over the SMA 50 curve which is a buy signal.
BTC/USD 4-hour chart
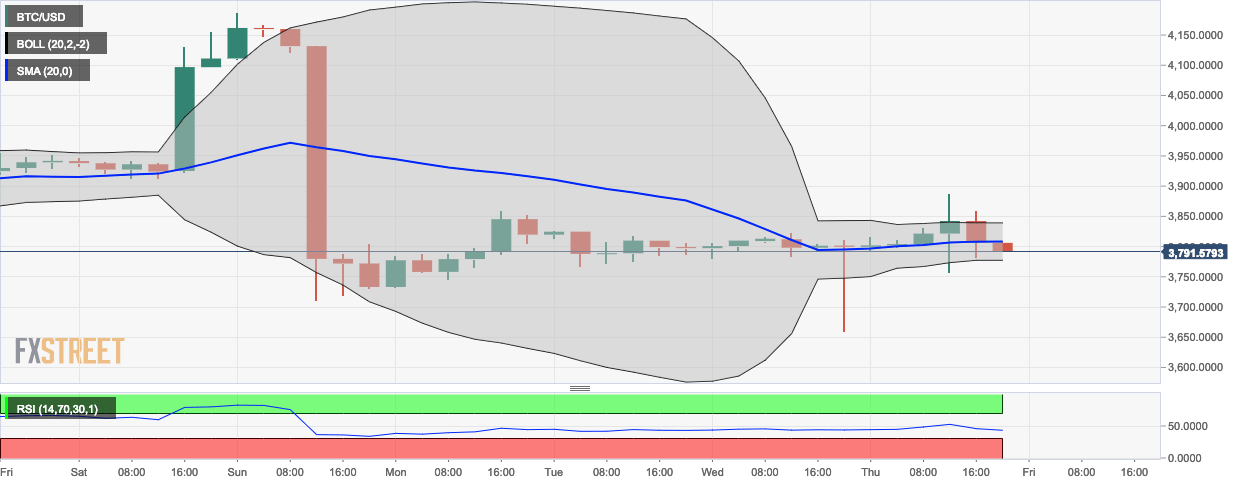
- The 20-day Bollinger band shows a decrease in volatility of the prices.
- The last session is trending in the lower half of the Bollinger band which indicates bearish behavior.
- The relative strength index (RSI) curve is leaning towards the oversold area.
BTC/USD hourly chart
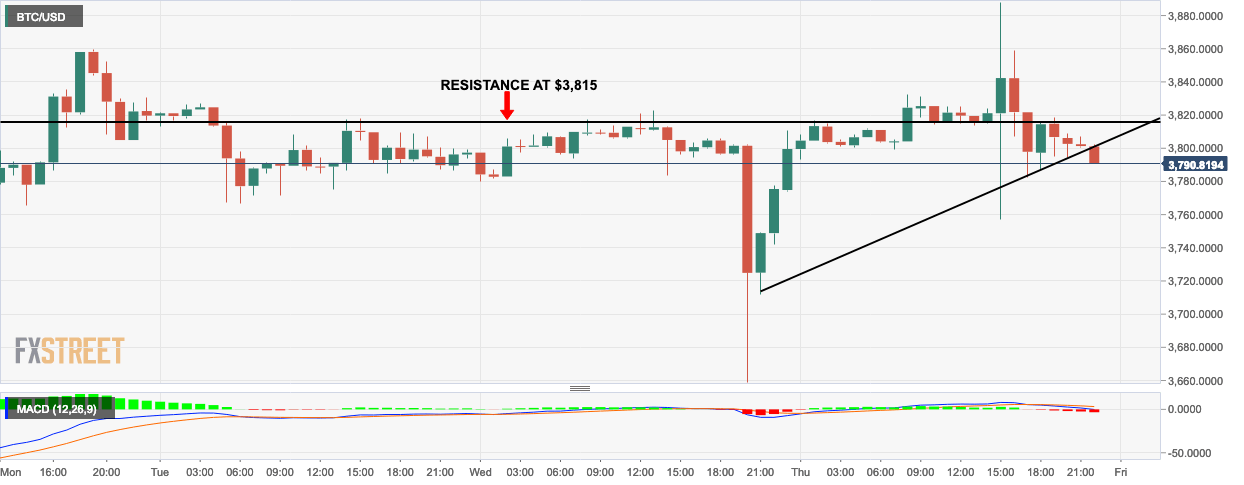
- BTC/USD hourly chart has had a bearish breakout from the triangle formation.
- The moving average convergence/divergence (MACD) histogram shows a reversal from bullish to bearish momentum.
Key Levels
- Resistance 3: $4,025.46
- Resistance 2: $3,924.10
- Resistance 1: $3,861.82
- Pivot Point: $3,760.46
- Support 1: $3,698.19
- Support 2: $3,596.83
- Support 3: $3,534.55
