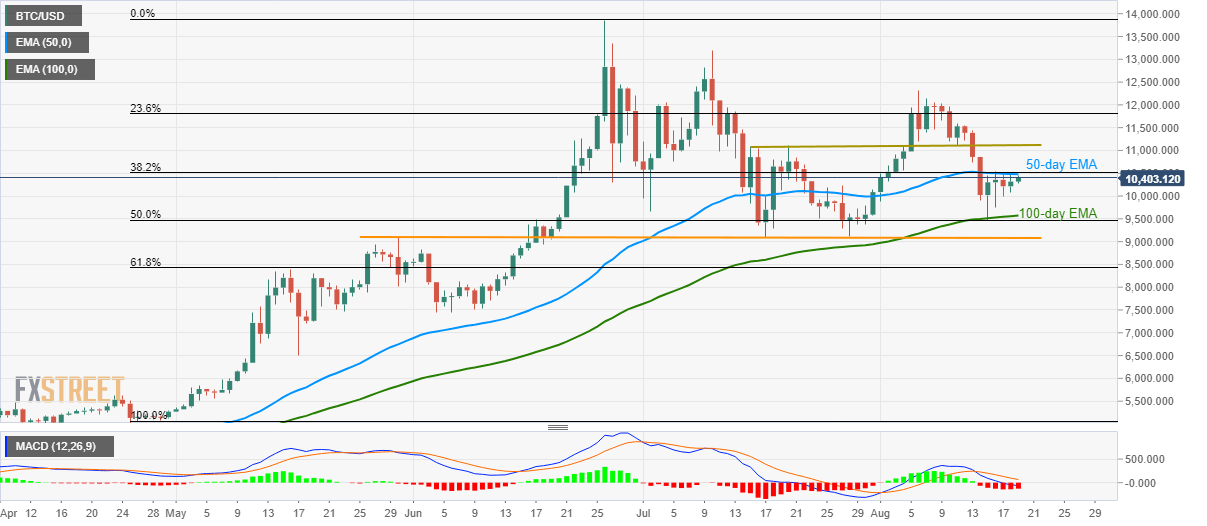
- BTC/USD rises to strong resistance comprising 50-day EMA, 38.2% Fibonacci retracement amid bearish MACD.
- 100-day EMA becomes the key support.
Having bounced off 100-day exponential moving average (EMA), the BTC/USD pair struggles to cross near-term important resistance-confluence while taking rounds to 10,385 on early Monday.
The quote faces a tough resistance around 10,480/520 that includes 50-day EMA and 38.2% Fibonacci retracement of April – June run-up.
While 12-bar moving average convergence and divergence (MACD) indicates a pullback, 10,000 round-figure can offer an intermediate halt ahead of dragging prices back to 100-day EMA level of 9,575.
Given the pair’s fall below 9,575, 11-week old horizontal support around 9,115/9,080 can grab sellers’ attention.
If at all buyers refrain from respecting bearish MACD, a month-long resistance-area between 11,080/120 can lure them.
BTC/USD daily chart
Trend: SIdeways

