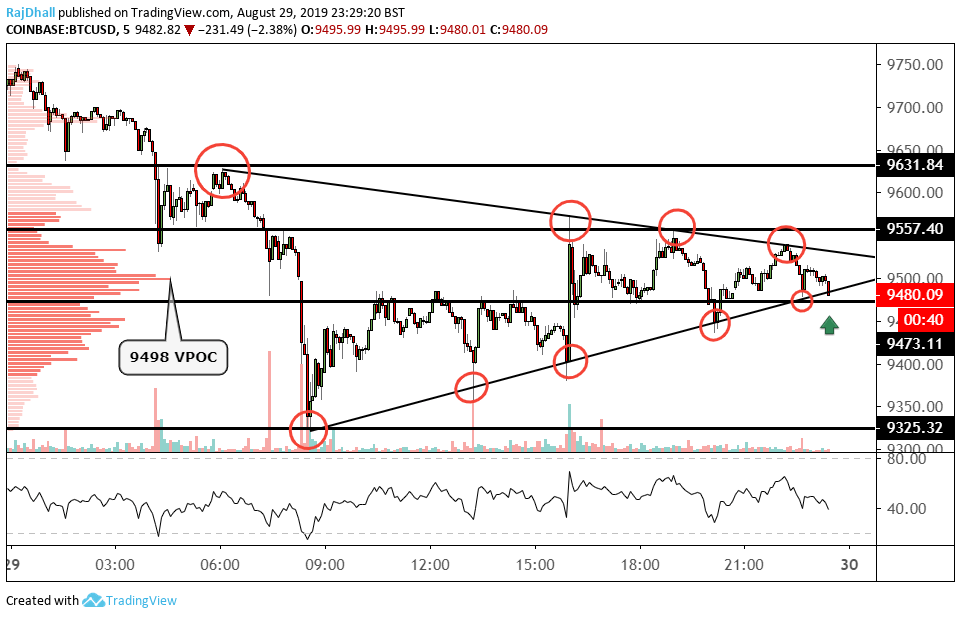
- BTC/USD has been forming a triangle formation all session and we have just seen a break lower.
- Price has recovered from the session lows of 9321.73 but we could see a move back down.
- The triangle formation has just broken to the downside with the next support at 9473.
The technical structure for today’s BTC/USD session has been textbook and the Bitcoin price has been recovering from session lows.
Right now we are testing the low of the triangle trendline, which has been tested five times in today’s session alone.
The RSI indicator is tilting to the downside but far from being oversold. Historically on the 5-minute chart price does tend to react with a move back into mean value.
On the volume profile composite indicator on the left-hand side of the chart we are currently close to but below the VPOC (volume point of control). This is where the most volume has been traded at a certain price for the session.
It remains to be seen if the break down marked by the arrow leads to more bearishness. If we do get a break then I am sure we could see a retest to match.
