- Bitcoin sentiment has been positive over the past few days with BTC/USD 1.64% higher in the session.
- There is a key technical level that BTC/USD has to contend with on the 4-hour timeframe.
- The 10k psychological price level is the next target with bulls controlling price action.
BTC/USD is trading very well this afternoon (UK time) as traders edge price toward the 10,000 psychological level.
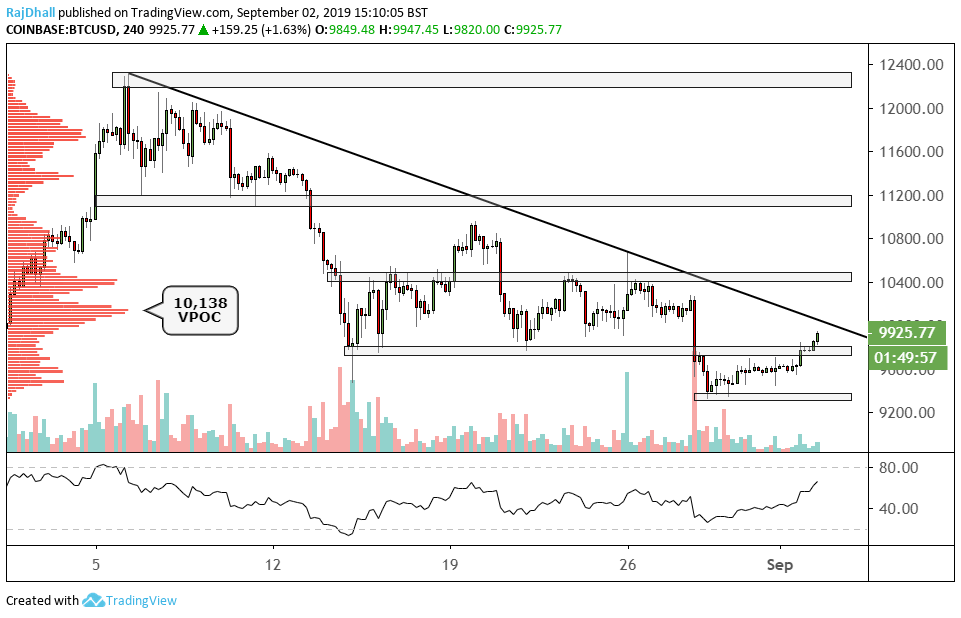
On the 4-hour chart above I have plotted a key trendline which could act as resistance for a move higher. The level has been tested before with good effect but this time price seems to have more momentum.
The RSI indicator is still pointing up and has some space before it reaches the overbought territory. On the 1-hour timeframe, we still have not made a divergence patter and this is good news as it shows buy side momentum is still increasing.
On the left-hand side of the chart the composite volume profile indicator is showing most contracts have traded at around 10,138 making it the mean value area. These levels tend to get respected by traders and it could be a resistance point in the short term.
The US are off for labour day so the session may be quiet but anything can happen in cryptoland!
