- Bitcoin has fallen another 6% today as sentiment still remains bearish.
- There are a few support zones lower down one of which is the golden Fibonacci ratio.
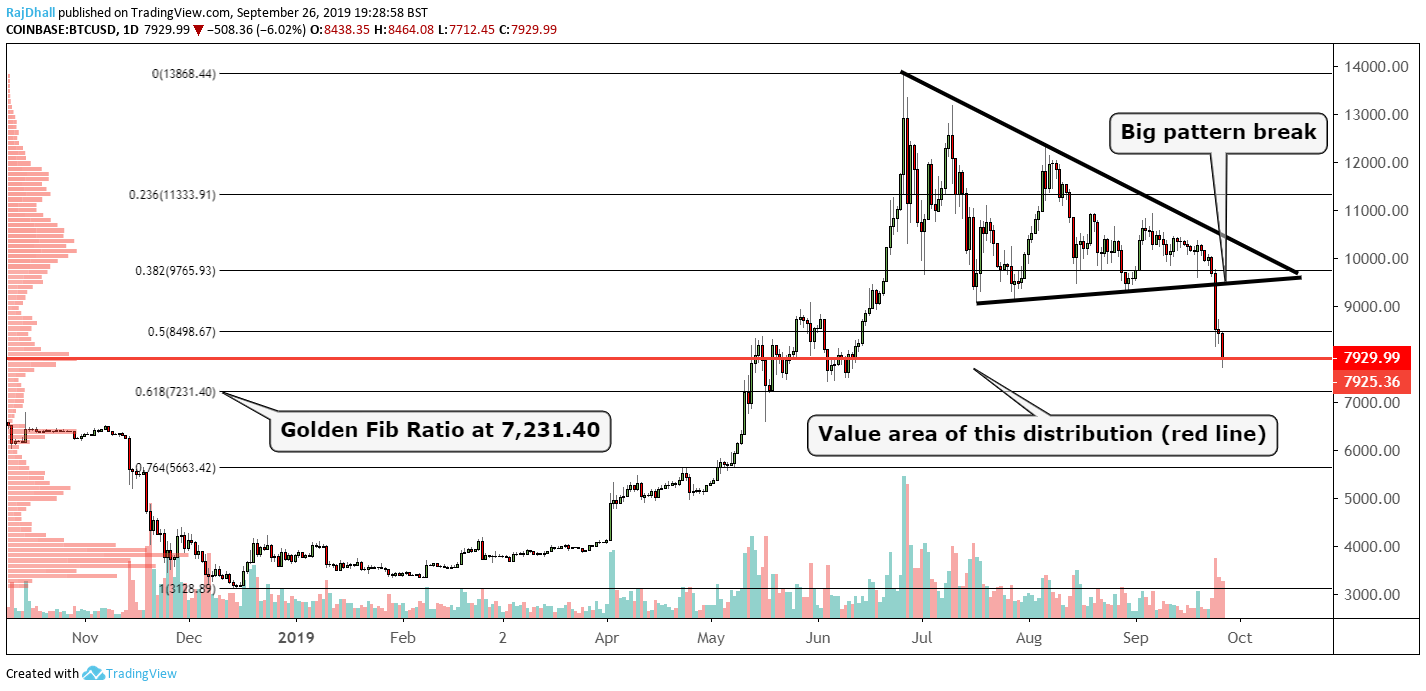
After the triangle pattern break on the daily chart below, it seems traders are desperately looking for areas of support.
This could either be as they cling on for dear life or looking for value to renter the trade looking for more profit.
Below, let’s see if we can find some answers from Mr, Fibonacci. The key golden ratio is 61.8% and it has been said it can be applied to everything from nature to human anatomy to finance (Google it if you don’t believe me).
The 61.8% ratio in this instance can be found at 7,321.40 and we are not too far off that point at the moment. Another key level on the chart is the volume point of control. This is marked on the chart by the red horizontal line. This is the area for this distribution the most buyers and sellers met. These levels are significant as they tell us where the market has an inflexion point or where buyers and sellers meet in the middle.
Now I must warn you trading is all about playing the percentages and nothing is certain. One of my favourite trading quotes is “do not create certainty where certainty does not exist”. So anything can happen but be aware if it is a key level other market technicians may notice and the self-fulfilling prophecy that is technical analysis may help you find the support level.