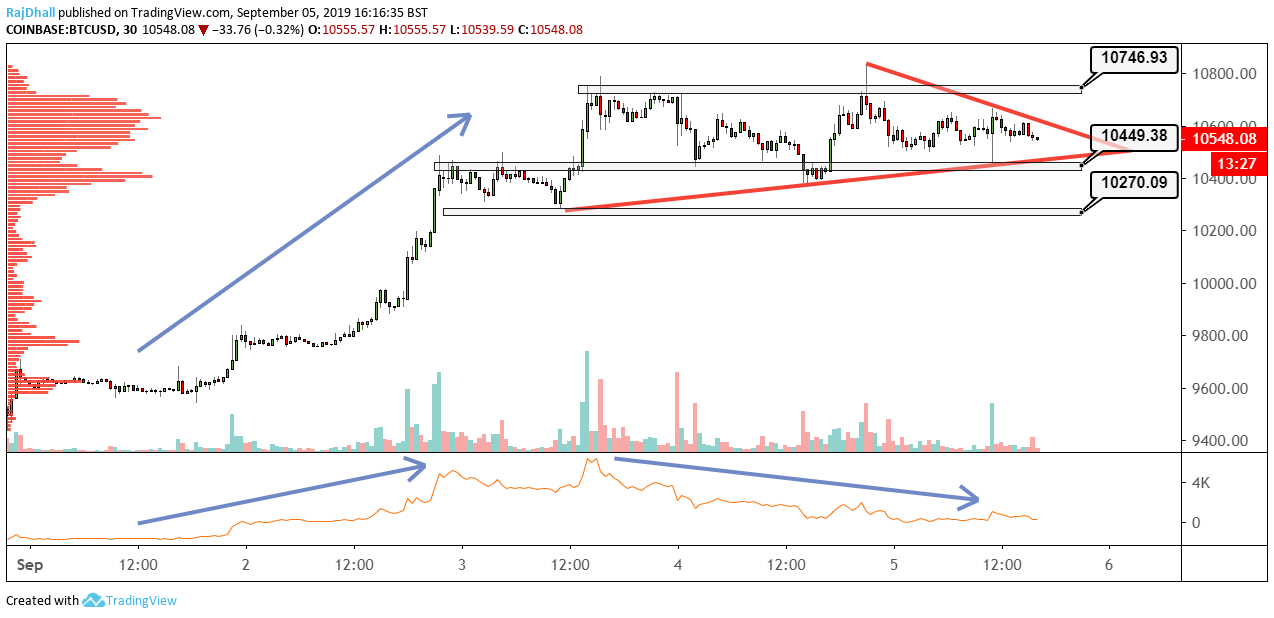
- Bitcoin is struggling for direction today as BTC/USD trades 0.32% lower on the session.
- The On Balance Volume indicator is shows lower highs while the price rose recently.
BTC/USD is trading 0.32% lower today after the price/volume looks like its struggling to push the BTC/USD price higher.
On the 30-minute chart above as the price makes higher highs and then consolidates between 10,400-800 and you can see the On Balance Volume (OBV) indicator move lower.
The OBV indicator is a great tool for measuring the momentum for a move. Traditionally of the indicator keeps moving higher as the uptrend develops you can see the market get behind the move and the trend will continue to rally.
There are obviously exceptions to the rule when all of a sudden big buying volume comes in but more often than not it does work.
I find the indicator is very useful when the internals are selling but the price is still moving higher or stable.
In this case, the indicator will move sharply lower while the price remains relatively stable.
For confirmation of a loss in momentum I would lookout for a break of the support levels on the chart. The first one is at 10,449 and the stronger one holds at 10,270. If they break then we could see conformation and the bears might be in charge.

