- Bitcoin sentiment is improved yet again with BTC/USD trading 0.72% higher.
- Now the trendline has been broken there is a key resistance level to break.
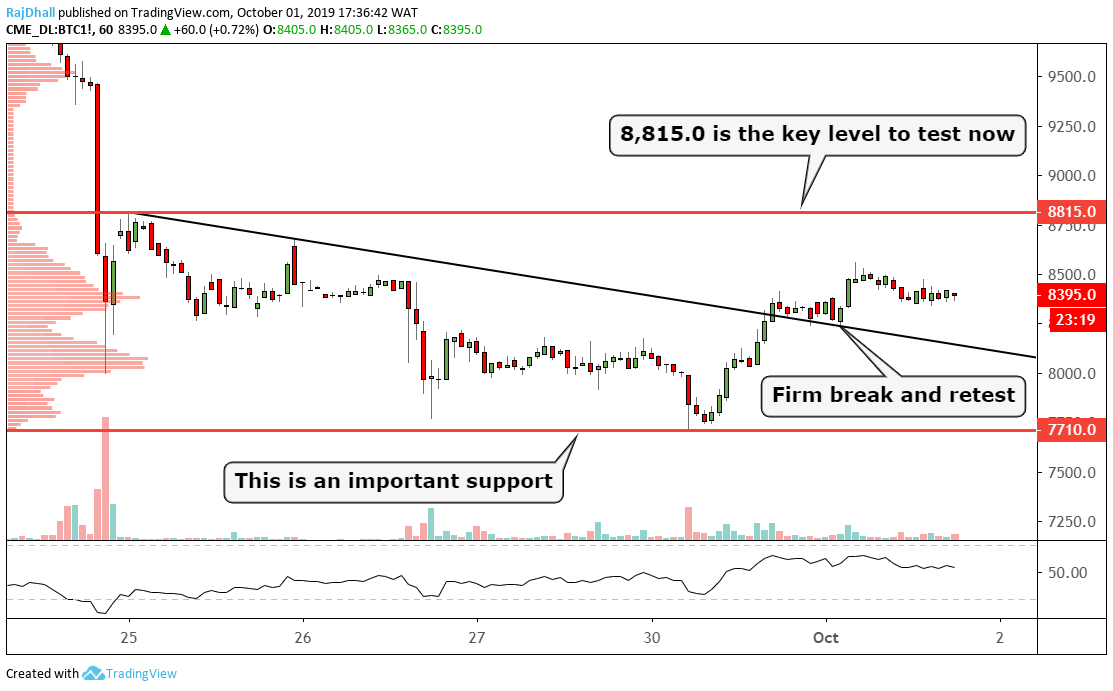
The consolidation pattern formed after the crypto fall on September 24th. Now the trendline was broken yesterday to complete the bullish break 8,815 would need to be broken.
Currently, the price is holding at the mean value area on the chart which is represented by the volume profile indicator on the left-hand side of the chart.
8,500 is now an intraday resistance point and bears pushed price back down below once already.
The technical pattern worked a treat as a break and retest formed but volume today is slightly light.
The relative strength indicator (RSI) is around mid-range and could hold above 50 if some buying pressure comes in but 8,500 seems to be the barrier at the moment.