- Bitcoin is testing the session high of 10,721 after a sudden surge of volume leading to a price rise.
- Sentiment has been pretty poor in the EU session but now the US and Asian traders are coming in sentiment is improving.
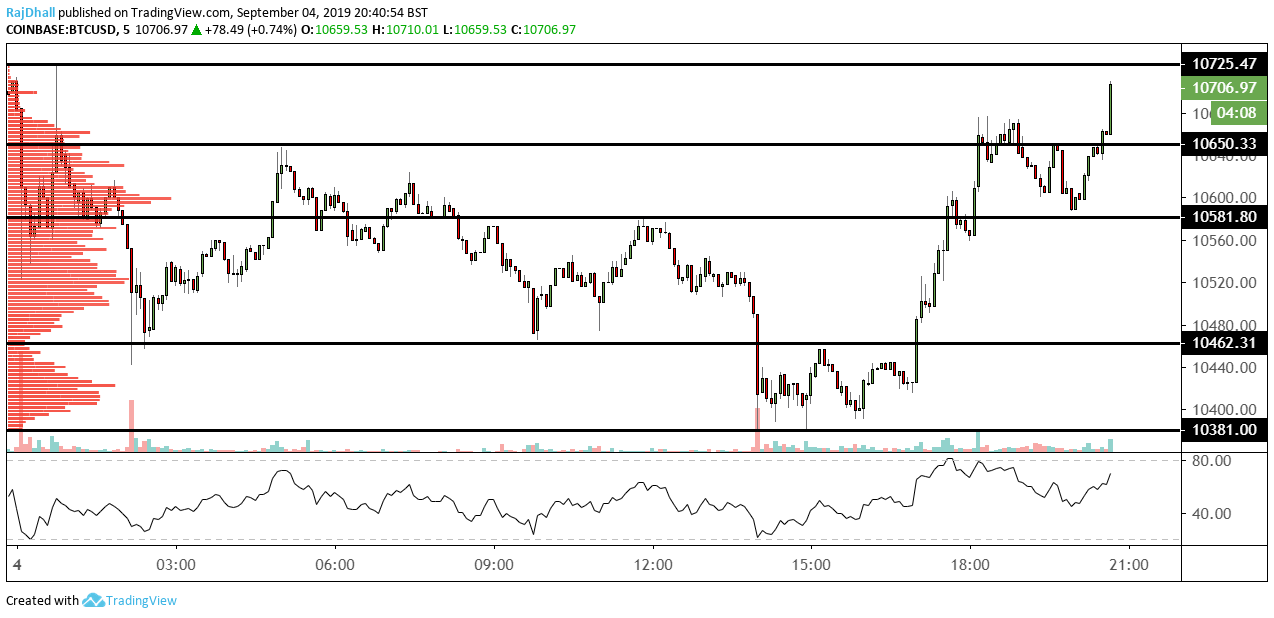
BTC/USD is moving higher as a sudden surge of volume pushes into the market.
The RSI indicator is showing a divergence as price waves make a higher high and the indicator makes a lower high. This sometimes shows a loss in momentum but in this case, momentum seems strong.
10,725 is the next resistance as it is the daily high. Above that is 10,955 and the psychological level of 11k. Yesterday’s high stands at 10,790 which could be a problem.
On the volume profile indicator, the next mean value area stands at 10,650 so if we get a retracement that could be a good target.
There have been some good stories today and a rumour that CME are about to launch BTC options in Chicago.
The full sory can be read here.
