- Cardano Founder Charles Hoskinson recently described ADA as a “financial operating system.”
- IOMAP shows that ADA’s upside is currently capped off at $0.080.
ADA = Financial operating system
In a recent interview with “Slot Leader,” Cardano founder Charles Hoskinson laid down his vision for ADA being the “financial operating system.” He said:
The general idea is that the system should be an end-to-end stack for economic identity. So what that means is that if some person in Senegal, or some person in Rwanda, or wherever, enters the system, they should have some place to place their data and their identity, to build a reputation. They should have some way of getting credit. They should have some way of interfacing with a currency that’s reasonably stable, that they can send to anybody in the world. They should have the ability to interface with exchanges. If they have a business, they should have the ability to securitize that business, so they have banking services, insurance services, credit services, remittance services.
IOHK, the company responsible for Cardano’s development, had announced a $250,000 fund to encourage on-chain development earlier this month. It is hoped that this fund will bolster growth as Cardano makes way for its next stage – Voltaire.
ADA/USD daily chart
-637365204185836245.png)
This Monday, ADA/USD had a bearish breakout from the descending triangle pattern. Following that, the price had another significant fall this Wednesday, wherein the price broke below the SMA 200 and the Bollinger Band. The buyers have since stepped back and taken the price up slightly to $0.0772. The price is currently kissing the Bollinger band’s lower curve as it attempts to get back inside. The relative strength index is hovering horizontally at the edge of the oversold zone. This should encourage the buyers to build up their Cardano holdings and push the price back up in the process.
ADA/USD 12-hour chart
-637365205076646629.png)
The 12-hour chart has flashed a buy signal in the TD sequential. The RSI is also trending along the edge of the oversold zone. Both these indicators should encourage the bulls to make a comeback. However, the price faces a significant obstacle up front, as per the IOMAP.
ADA IOMAP
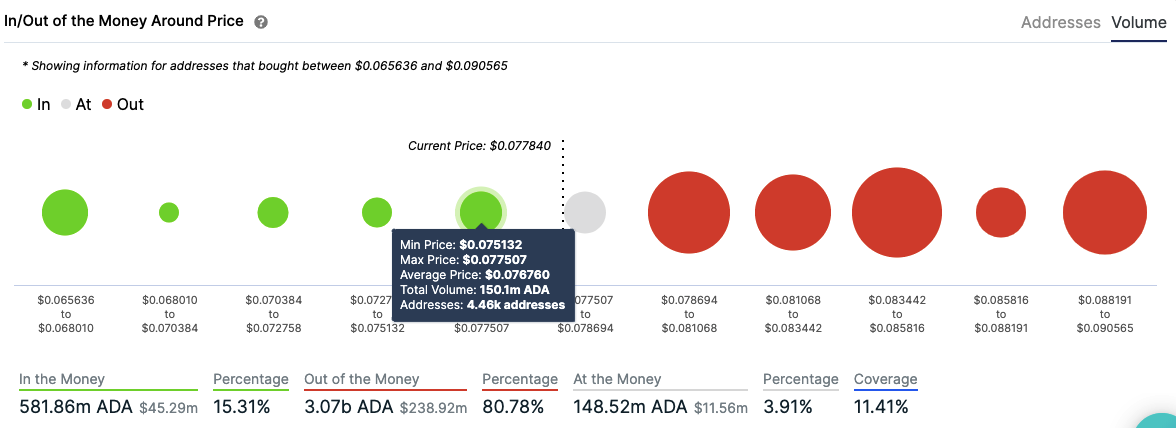
IntoTheBlock’s “In/Out of the Money Around Price” (IOMAP) model estimates that there are some solid resistance walls upfront. The immediate resistance is at $0.0795, wherein 12k addresses have previously bought around 685M ADA. If the buyers somehow gain enough momentum to break past this level, there are still way too many barriers up front.
However, if the sellers retain their control of the market and thwart any bullish advances, the story could become pretty catastrophic for ADA holders. The price is currently sitting on top of a weak-to-moderate support wall at $0.076, where 4.46k addresses have bought a little over 150M ADA. If they break below this, the next support wall of note is at $0.0665.
