- Cardano price is bound for high volatility following a long consolidation period.
- The bulls seem to be targeting $0.45 while the bears aim for $0.20.
- On-chain metrics hint at a stiff supply barrier at $0.35, which seems to favor the bearish outlook.
Cardano price saw a meteoric surge of 200% from late-December 2020 to mid-January 2021. However, the smart contracts token has been stagnant over the past two weeks showing an ambiguous outlook. A potential breakout could see ADA move by roughly 30% in either direction, but on-chain indicators skew with the bears.
Cardano price sits at a make-or-break point
ADA’s consolidation phase is nearing completion as its price trades around the $0.35 level. But, a symmetrical triangle formation indicates that the breakout could happen in either direction.
Since Cardano has not experienced a significant retracement after it entered a 300% bull rally in the last two months, it is reasonable to assume that it sits in overbought territory.
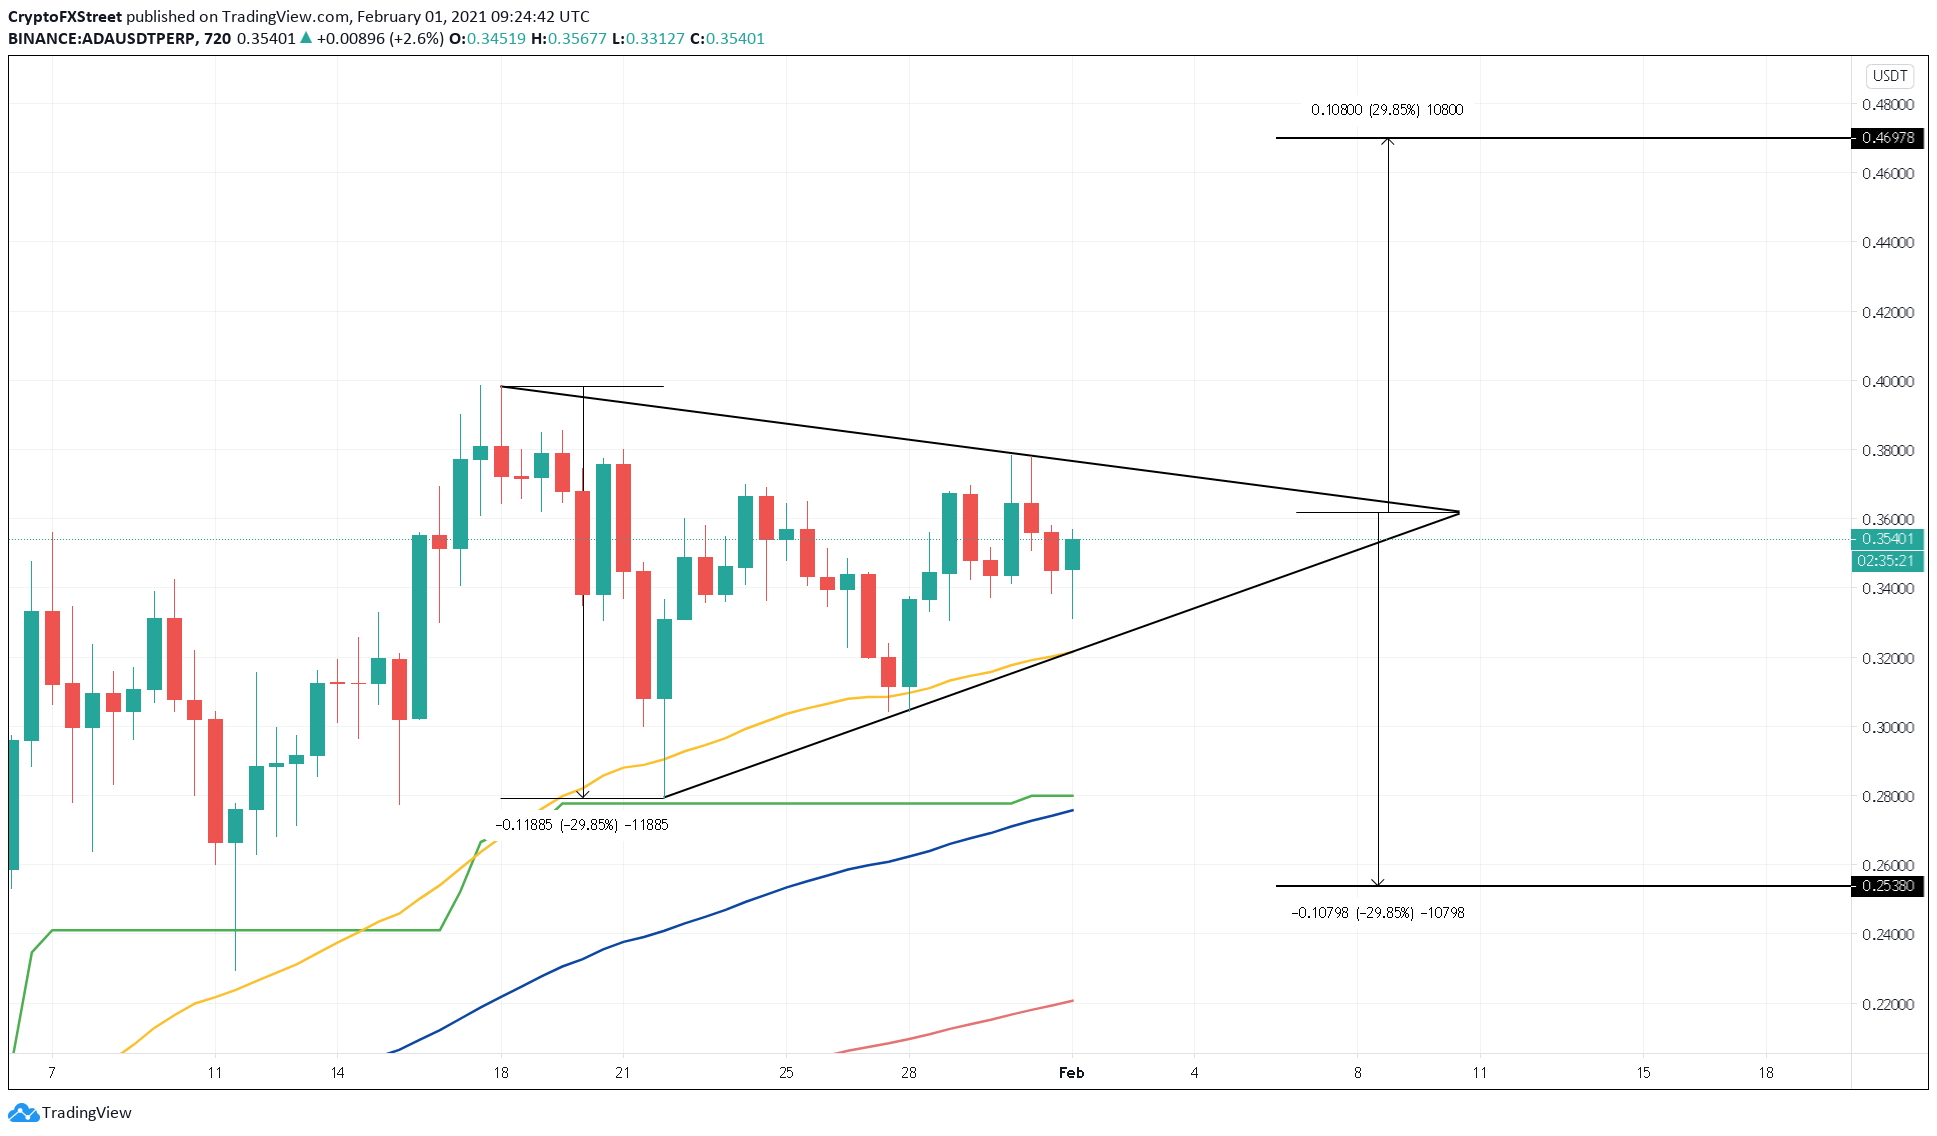
ADA/USD 12-hour chart
The bearish thesis holds when looking at IntoTheBlock’s In/Out of the Money Around Price (IOMAP) model. This on-chain metric shows a massive concentration of underwater investors at $0.354 who are more than likely to sell their holdings to break-even.
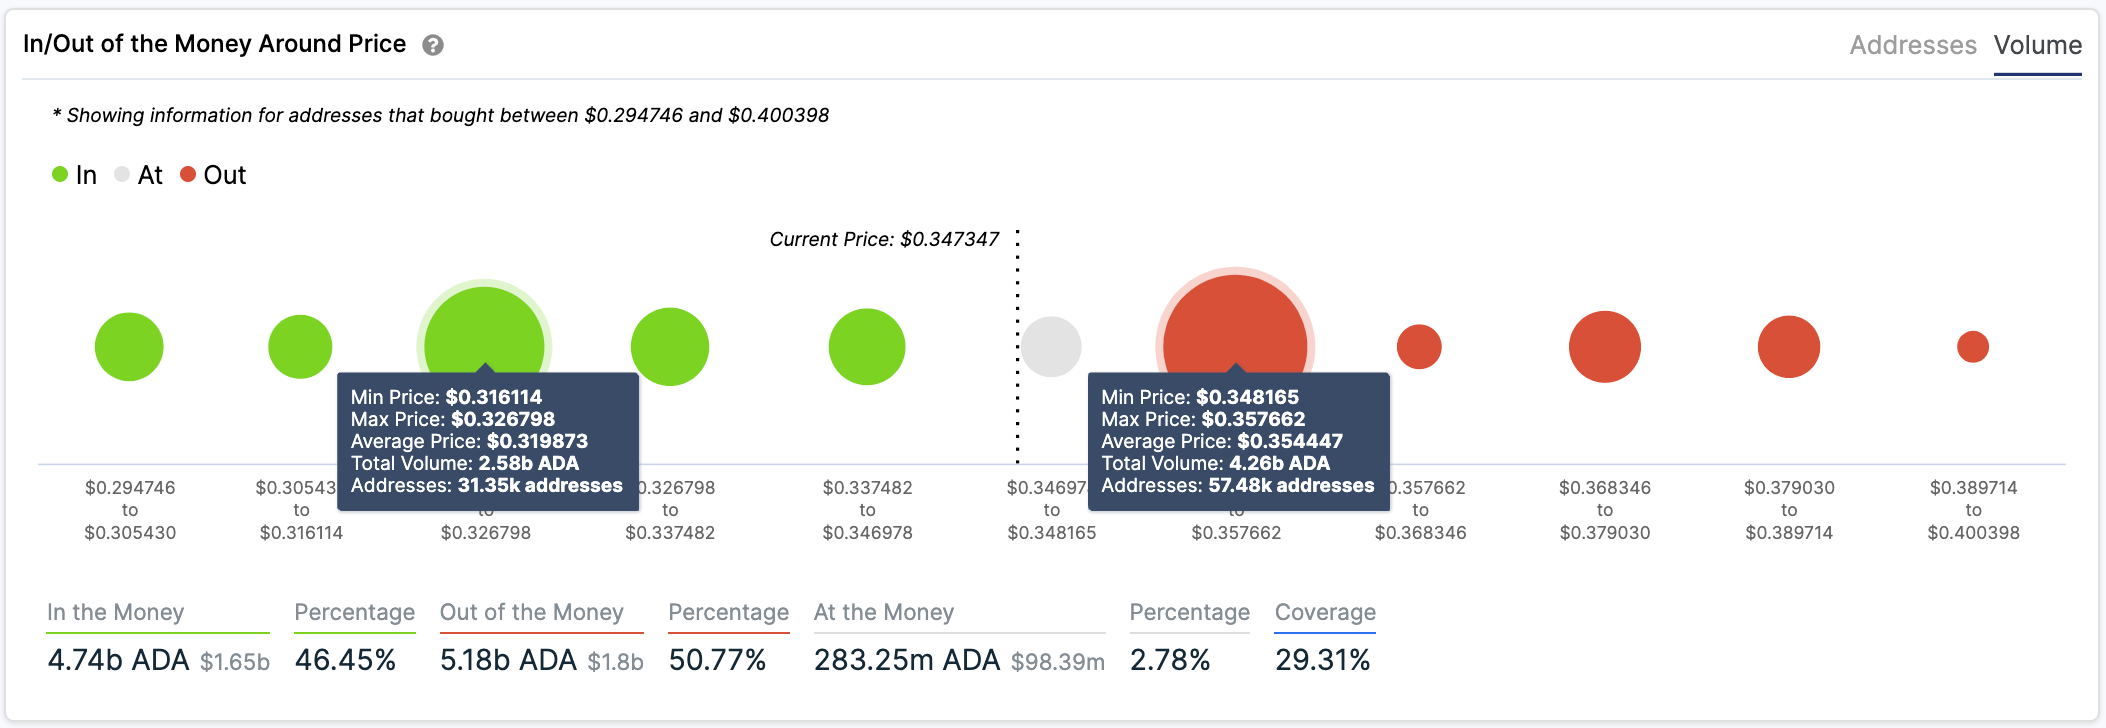
Cardano IOMAP
A spike in sell orders that pushes Cardano price below the 50 twelve-hour EMA will likely validate the bearish outlook. The downswing could be followed by further downward pressure sending ADA towards the $0.27 level where the SuperTrend indicator and the 100 twelve-hour EMA converge.
It would be extremely bearish for ADA price to breach this confluence, as it would cause it to drop towards the 200 twelve-hour EMA around the $0.20 level.
Nonetheless, Cardano could avoid further losses if its price heads higher and breaches the critical supply barrier at $0.354, and closes above $0.38. If this were to happen, ADA price will rise by 30% and target $0.47.
