- ADA/BTC trading pair breakout from a parallel descending channel is aiming for 0.00001 BTC.
- ADA/USD faces a challenging path to $0.1, as highlighted by IntoTheBlock’s IOMAP model.
The ADA/BTC trading pair is finally singing to the tune of the bullish trends we have recently discussed. Buy signals have been validated and it is upon as to explore how far the breakout will go. At the time of writing, ADA/BTC is teetering at 0.00000824 BTC amid a fast building bullish momentum.
Cardano as a global financial operating system
The founder of Cardano, Charles Hoskinson, in a recent Slot Leader Podcast, said that the world is heading to a point where only one currency will be in operation. He explained that the battle for the number one spot has begun and, therefore, it is time to improve and build “the world’s financial system.”
According to Hoskinson, Cardano has been developed as a global operating system that represents identity, value and governance, all in one platform. The protocol will eventually have the ability to issue stocks, bonds, commodities, utility tokens, and carry out anti-money laundering practices.
ADA/BTC parallel channel breakout aims for 0.00001BTC
The ADA/BTC pair traded a yearly high of 0.000016 BTC towards the end of July. The yearly highs marked the end of the bull-run commenced in March after exchanging at a low of 0.0000042 BTC. Most of the gains accrued amid the launch of Shelly, as previously reported. A retreat engulfed the cryptoasset with declines becoming unstoppable in a parallel descending channel.
Cardano recently found support at 0.0000074 BTC, giving way and hope for a reversal. With the parallel descending channel resistance now in the rearview, ADA/USD is expected to continue with the uptrend, and perhaps overcome the hurdle at 0.00001 BTC in the coming days.
Read more: Cardano Price Analysis: ADA flashes buy signal in 12-hour chart
ADA/BTC daily chart
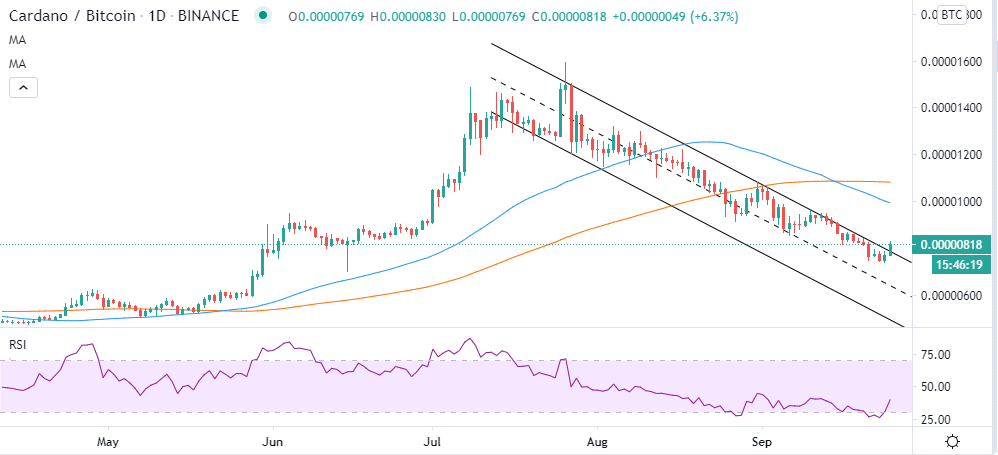
The Relative Strength Index (RSI) shows how strong a trend is (up, down, or sideways). In this case, it is moving fast towards the midline. Movement above the average could see a ripple effect, resulting in a rally towards the coveted 0.00001 BTC level.
IntoTheBlock’s IOMAP model reveals a challenging path heading to $0.1. The increasing resistance will be an uphill task for the bulls, culminating at the highest seller congestion, $0.09 – $0.1. Here, nearly 10,800 addresses previously bought 1.97 billion ADA.
Cardano IOMAP chart
-637366228630632103.png)
On the downside, ADA/USD is sitting on an area of immense support where the highest buyer congestion is highlighted between $0.078 and $0.079. Here, about 14,500 addresses previously purchased approximately 936 million ADA.
Looking at the other side of the picture
It is essential to keep in mind the death-cross after the 50 MA crossed below the 100 SMA. In other words, selling pressure is still present and is likely to dampen the buying pressure, delaying the breakout. The ADA/USD 1-hour chart highlights resistance at $0.088. Cardano has already been rejected from this resistance level and struggles to hold above the short term support at $0.086.
ADA/USD 1-hour chart
%20(18)-637366234869136546.png)
The RSI is retreating from the overbought as a sign of exhaustion in the bullish camp. The hourly ADA/USD chart validates the resistance revealed by the IOMAP model. At the same time, a reversal is unlikely to ravage through the strong support between $0.078 and $0.079.
