- Cardano price is currently bounded inside a parallel channel on the hourly chart.
- Bollinger Bands squeezing indicates a significant breakout could happen soon.
Cardano had an early recovery on November 28 ahead of Bitcoin’s last move toward $20,000. The digital asset is now consolidating and trading sideways as indicators show it is ready for another breakout in the short-term.
Cardano price awaits a clear breakout
Cardano is currently trading at $0.168 after a notable breakout on November 28. The price seems to be contained inside a parallel channel formed on the hourly chart with the upper trendline at $0.173 and the lower boundary at $0.159.
ADA/USD 1-hour chart
Additionally, the Bollinger Bands have squeezed significantly over the past two days in the hourly chart, and both boundaries coincide with the trendlines of the parallel channel. A breakout above $0.173 could quickly push ADA to $0.18 and $0.20 at the 1.27 Fib level.
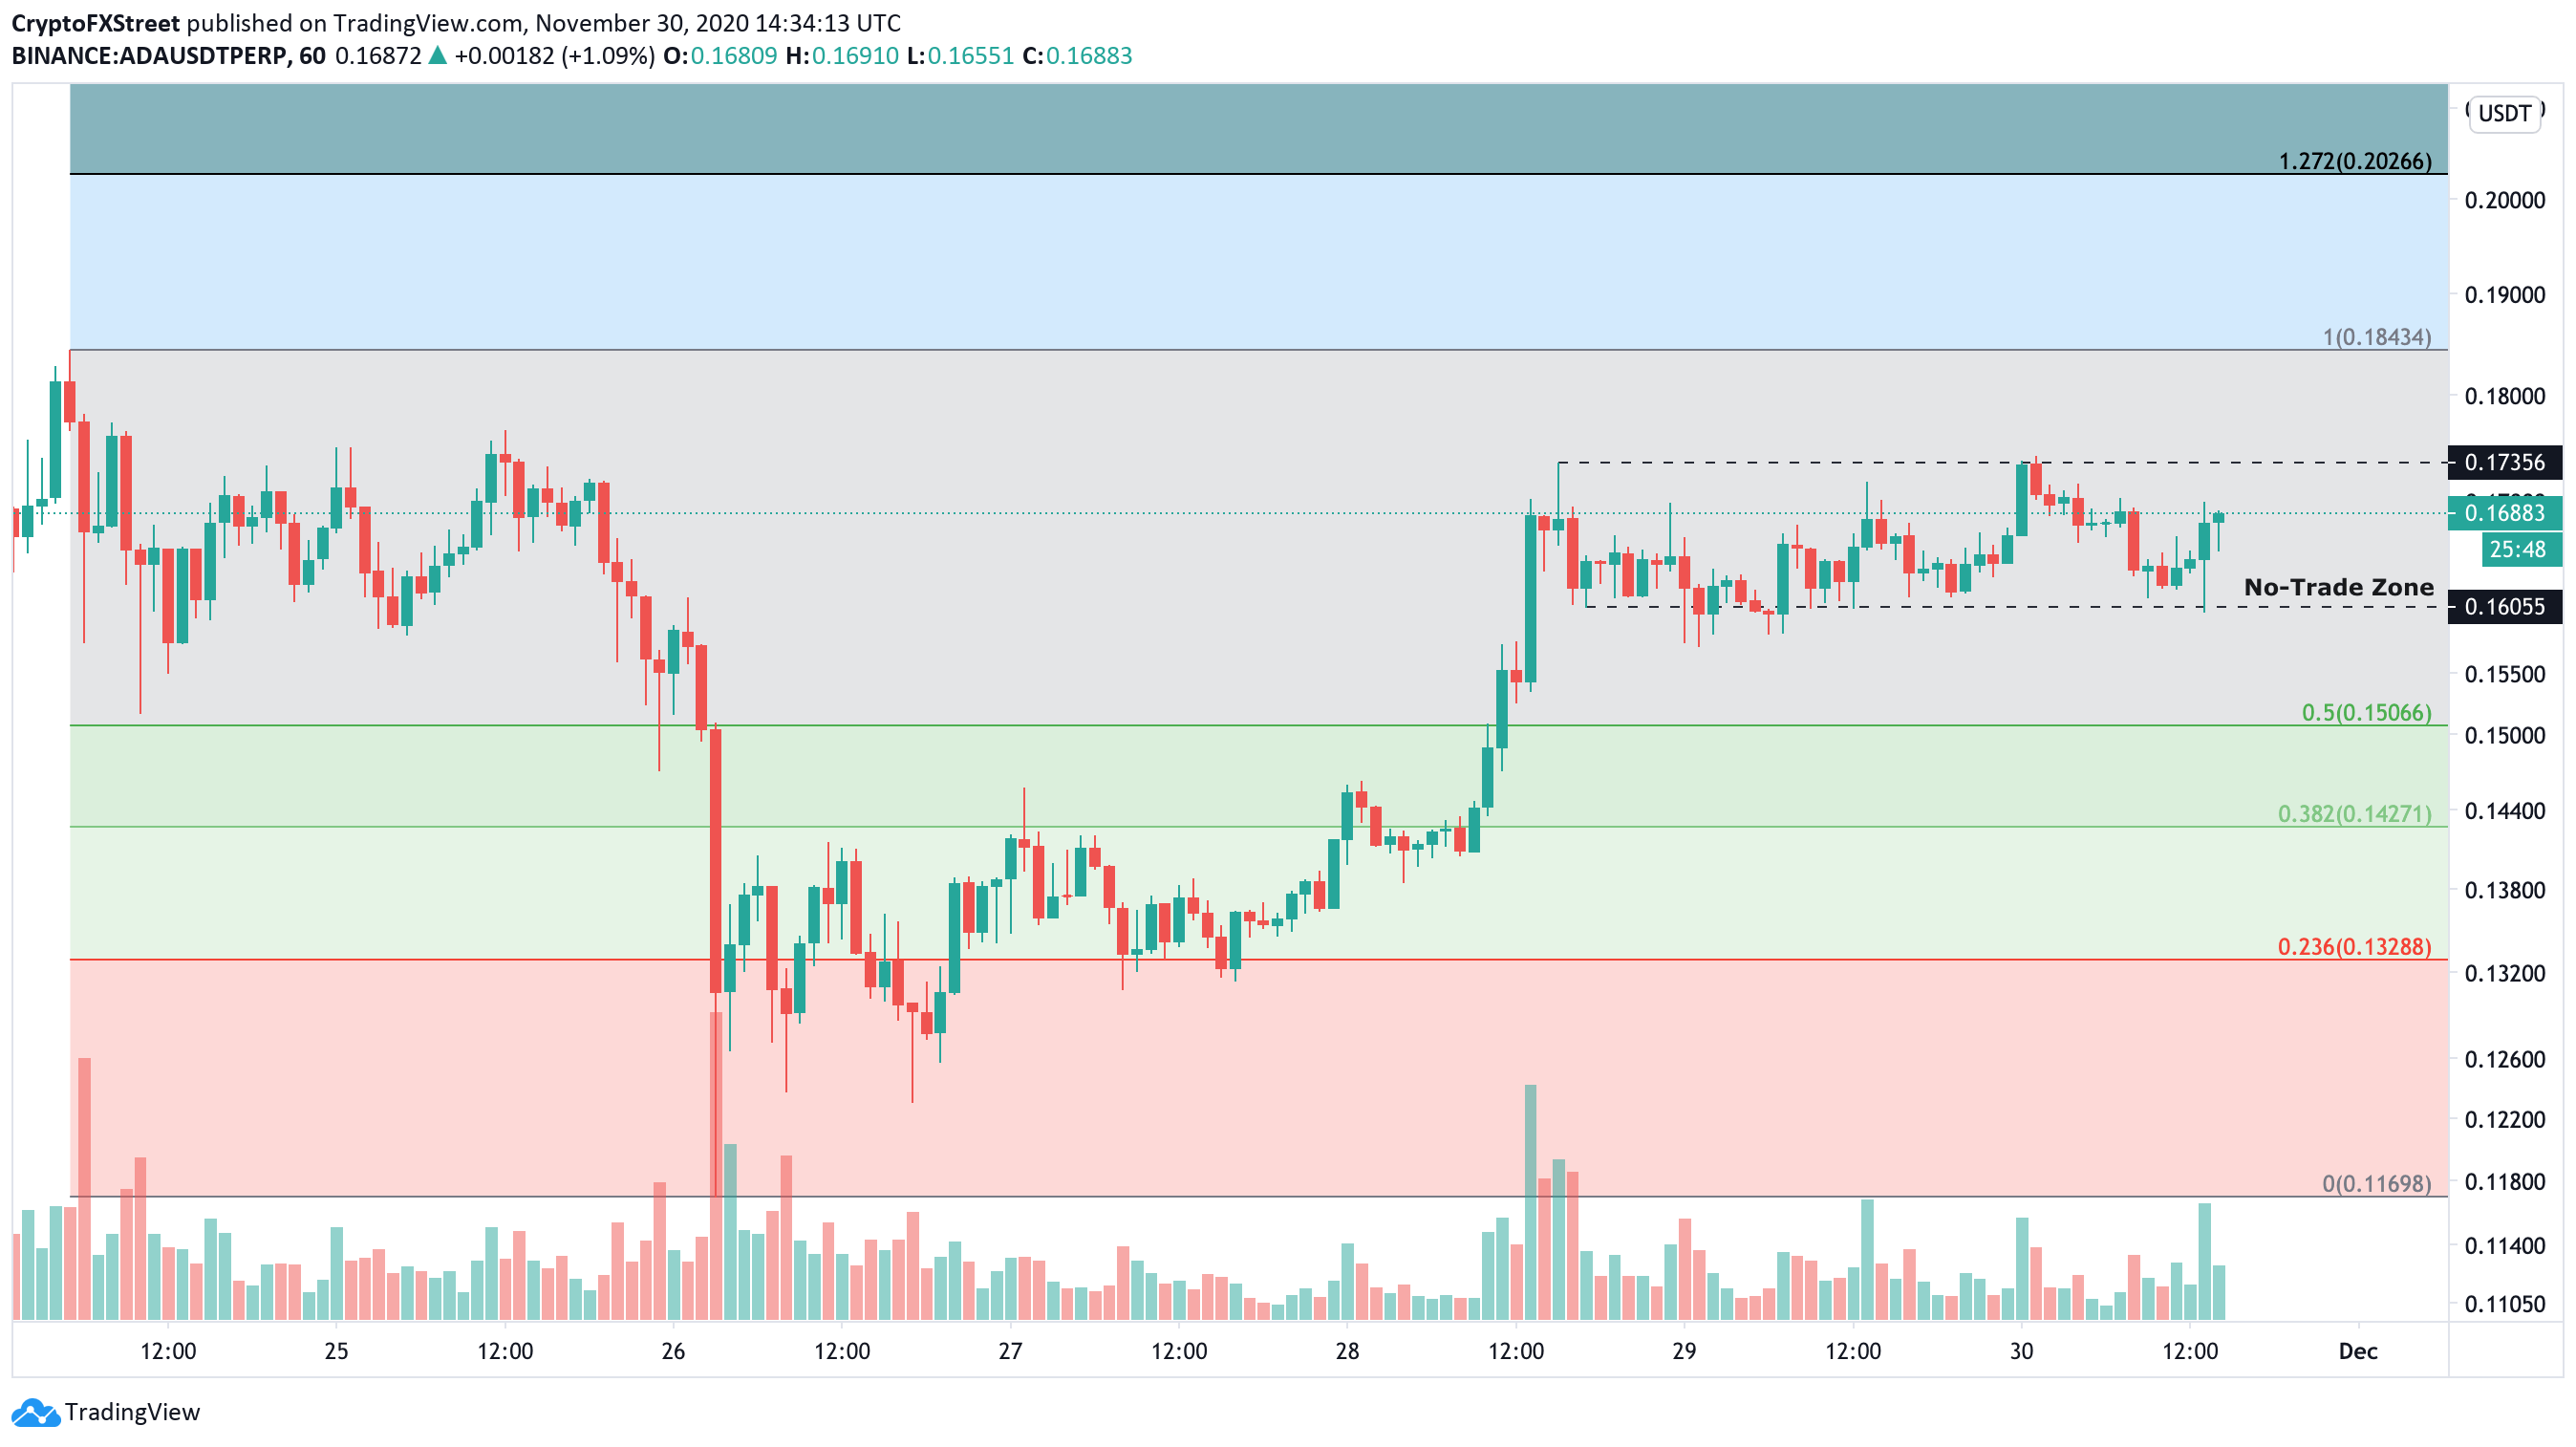
ADA/USD 1-hour chart
On the other hand, a breakdown below the channel’s lower line and the Bollinger Band can push ADA to slice through the $0.15 support level at the 0.5 Fib level down to $0.142, the 0.382 Fib level.
