- Cardano price seems to be on the verge of a massive breakout after cracking a long-term trendline resistance.
- After a brief consolidation period, it seems that Cardano is ready to resume its uptrend.
Cardano had a significant rally towards $0.355 at the beginning of 2021. After a notable dip to $0.228, bulls bought it and managed to push Cardano price to $0.33 again before a small rejection.
Cardano price needs to clear the $0.33 level to see a massive breakout
On the weekly chart, Cardano broke out from a reverse head and shoulders pattern and seems to have retested the neckline resistance trendline. This breakout had a price target of $2.12 which represents a 900% increase. The target was determined using the height from the neckline trendline to the head.
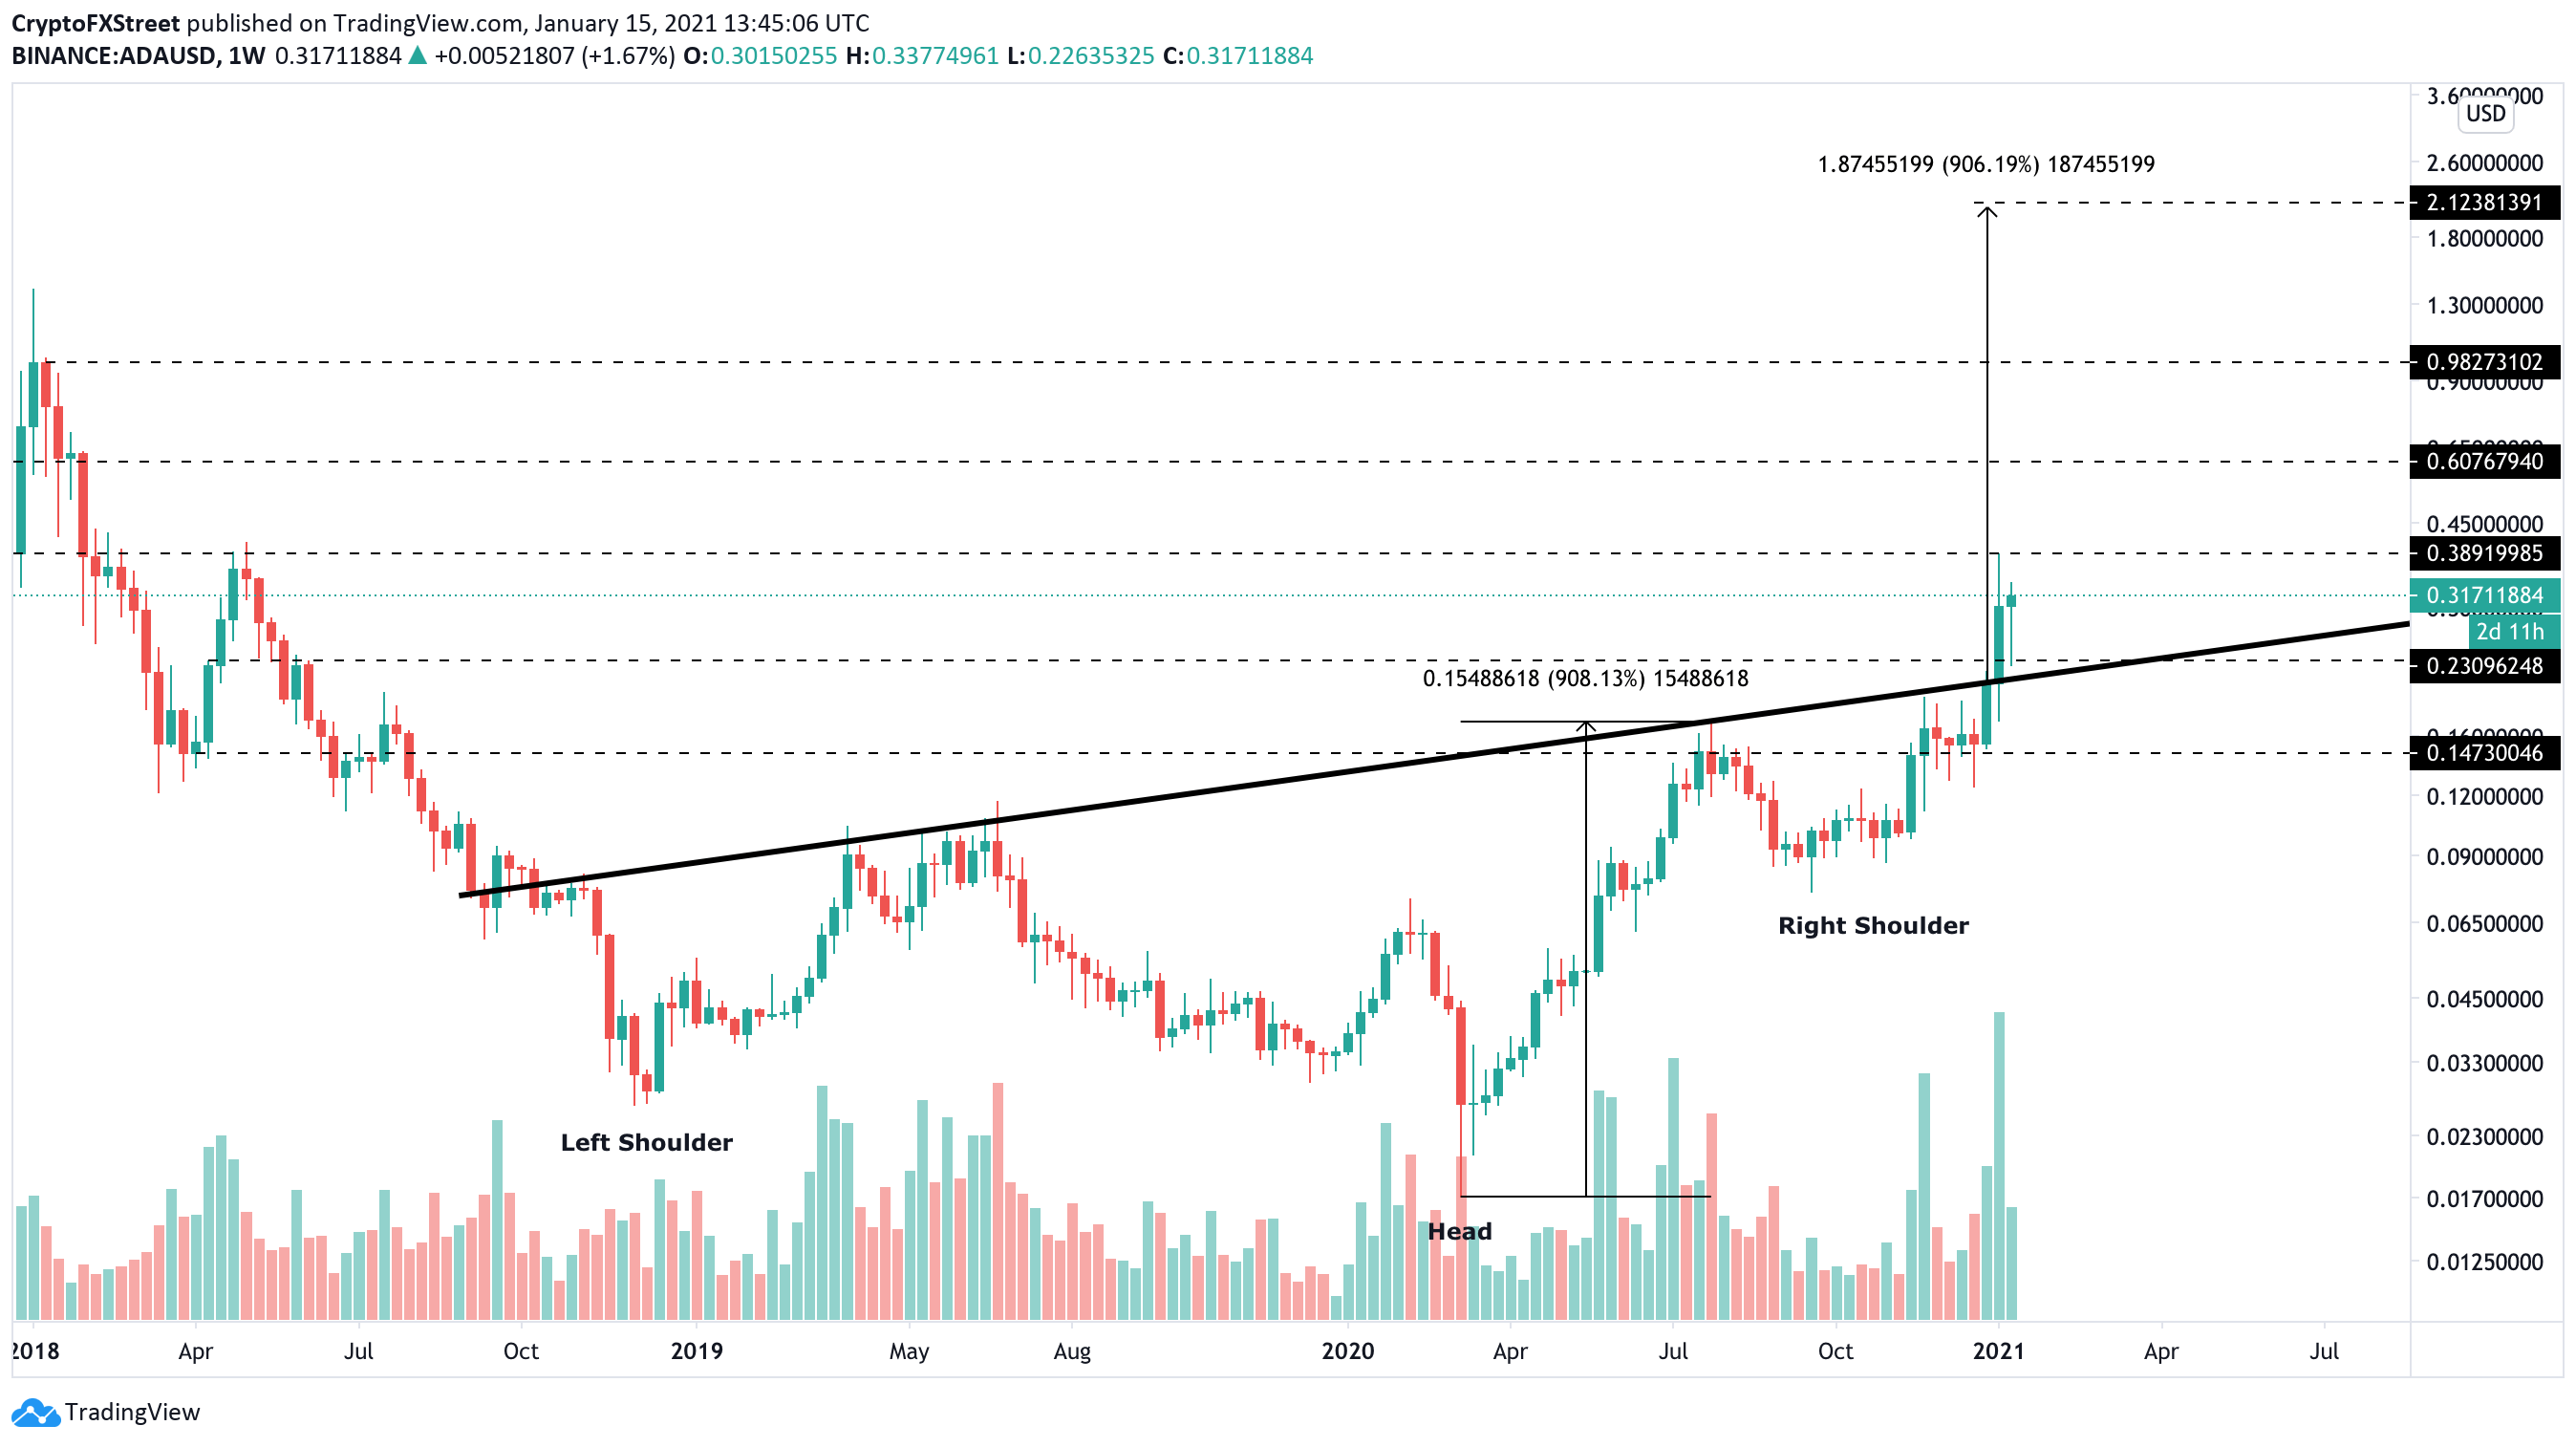
ADA/USD weekly chart
On the 12-hour chart, Cardano price has established a critical resistance level at $0.33 in the short-term. A breakout above this point can quickly start to push the digital asset towards the $2.12 long-term price target.
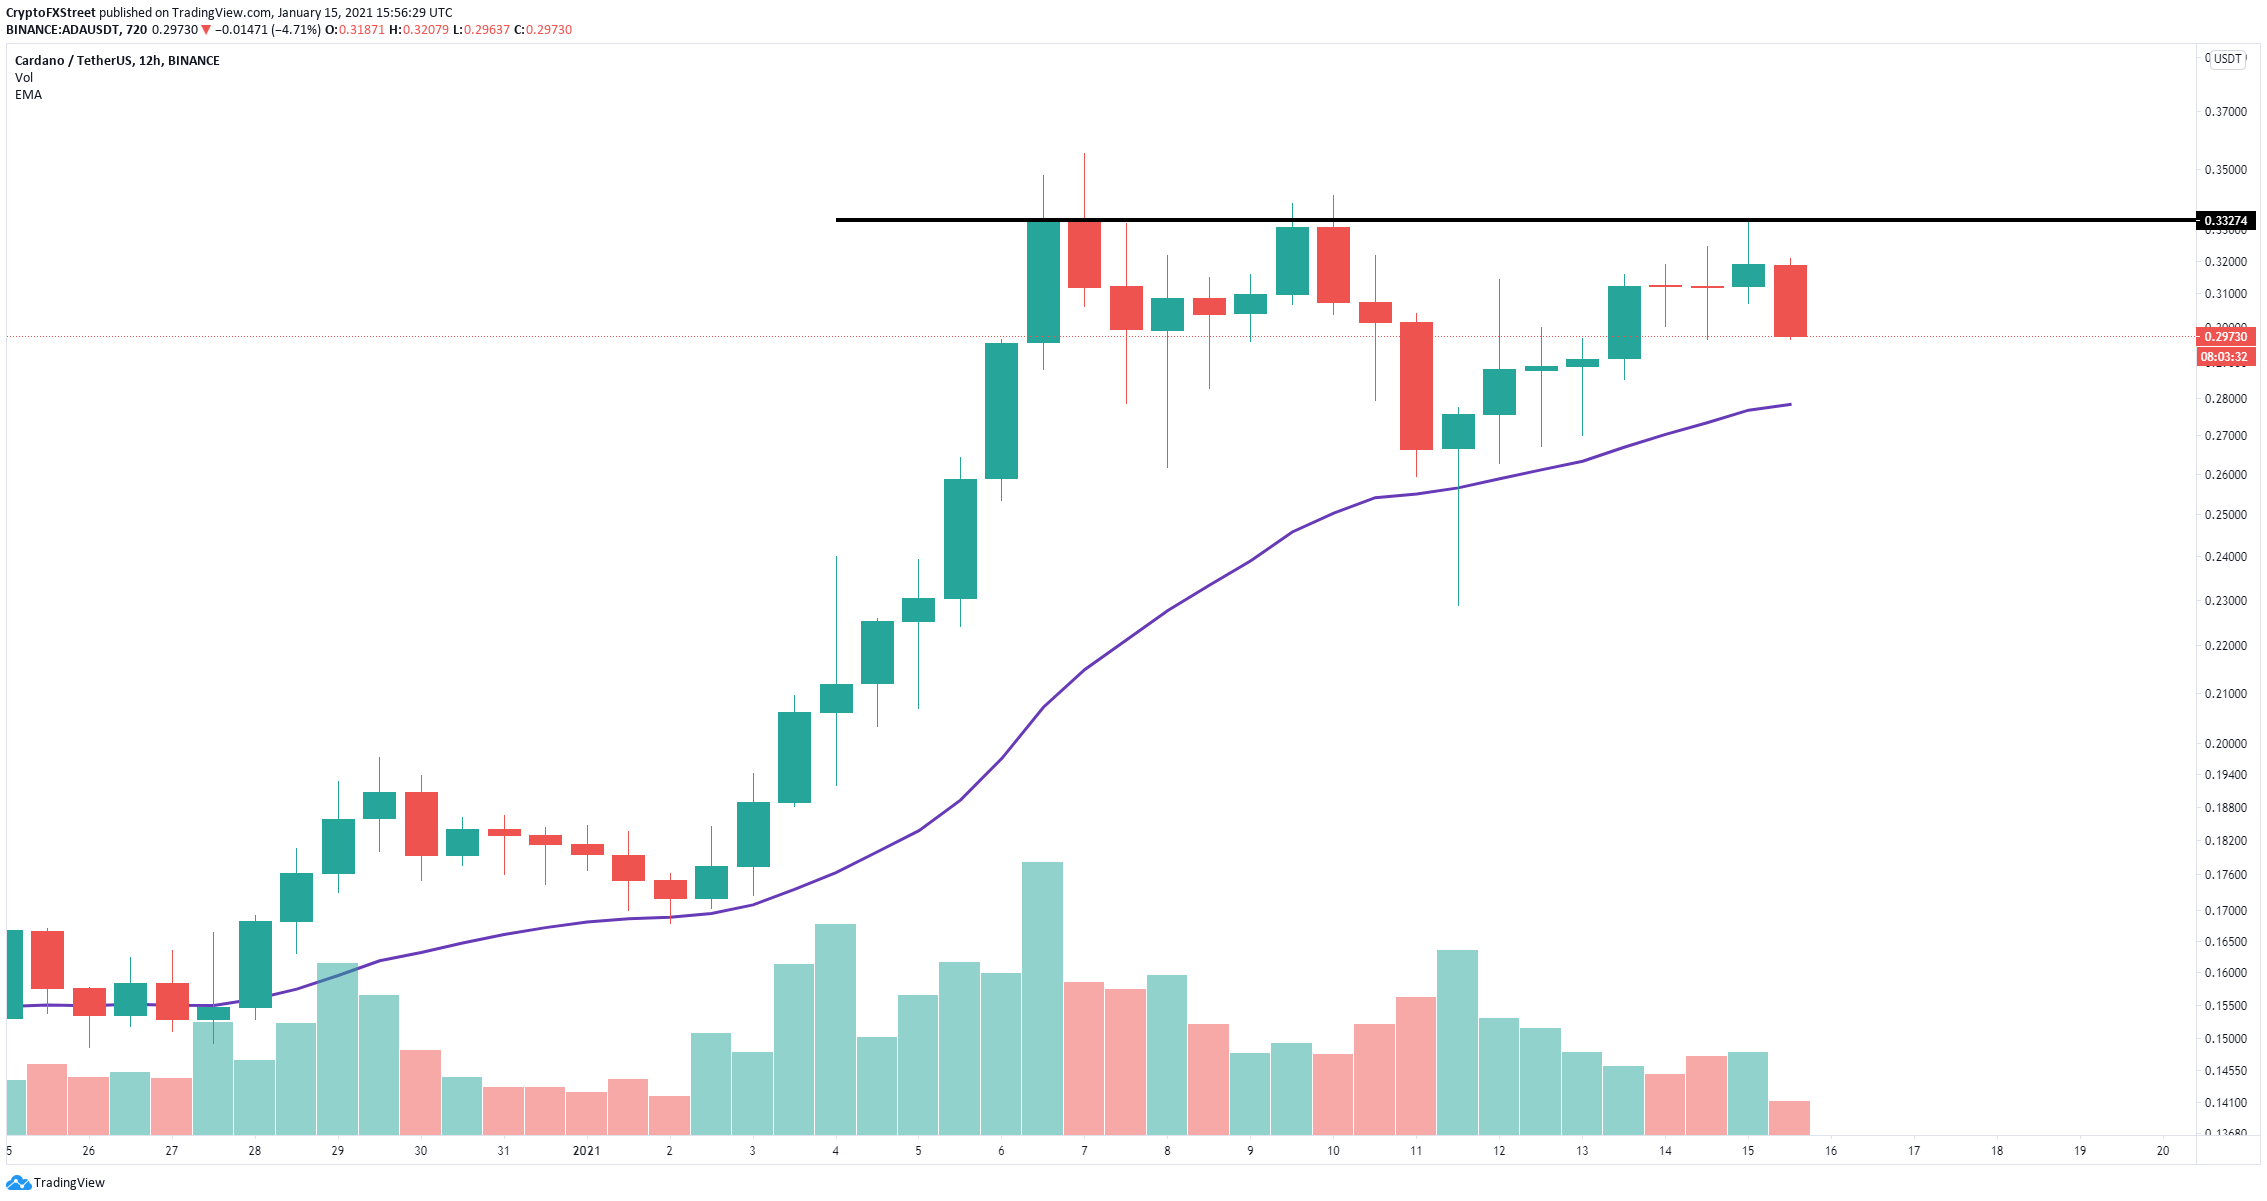
ADA/USD 12-hour chart
Cardano bulls can find a lot of support at $0.28 which is the 26-EMA. Additionally, the In/Out of the Money Around Price (IOMAP) chart shows a robust support area between $0.318 and $0.30 and another one between $0.28 and $0.29 which coincides with the 26-EMA.
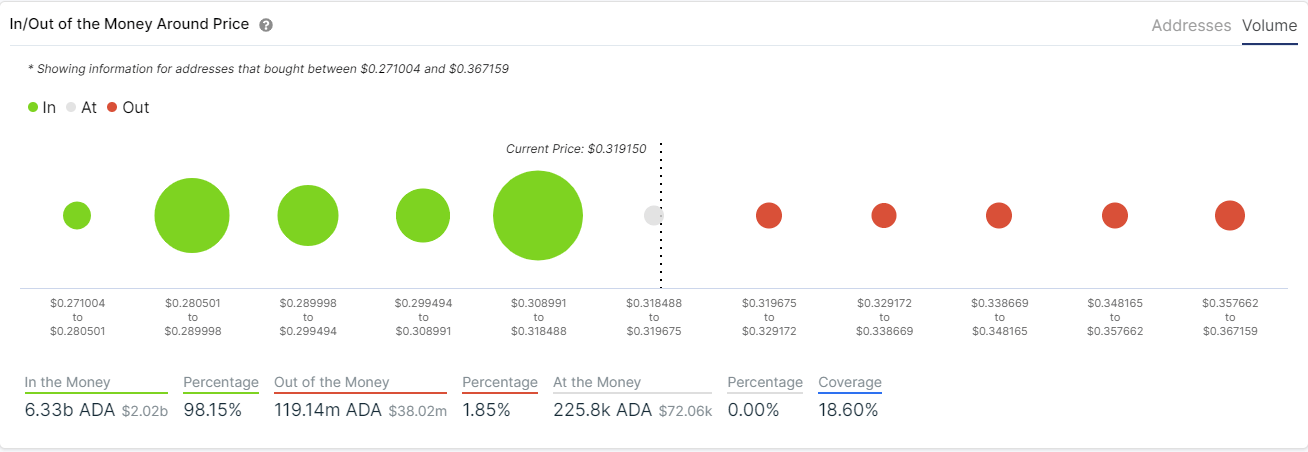
ADA IOMAP chart
However, losing this crucial support level would be a notable bearish sign capable of sending the digital asset down to $0.20, the next psychological support level.
