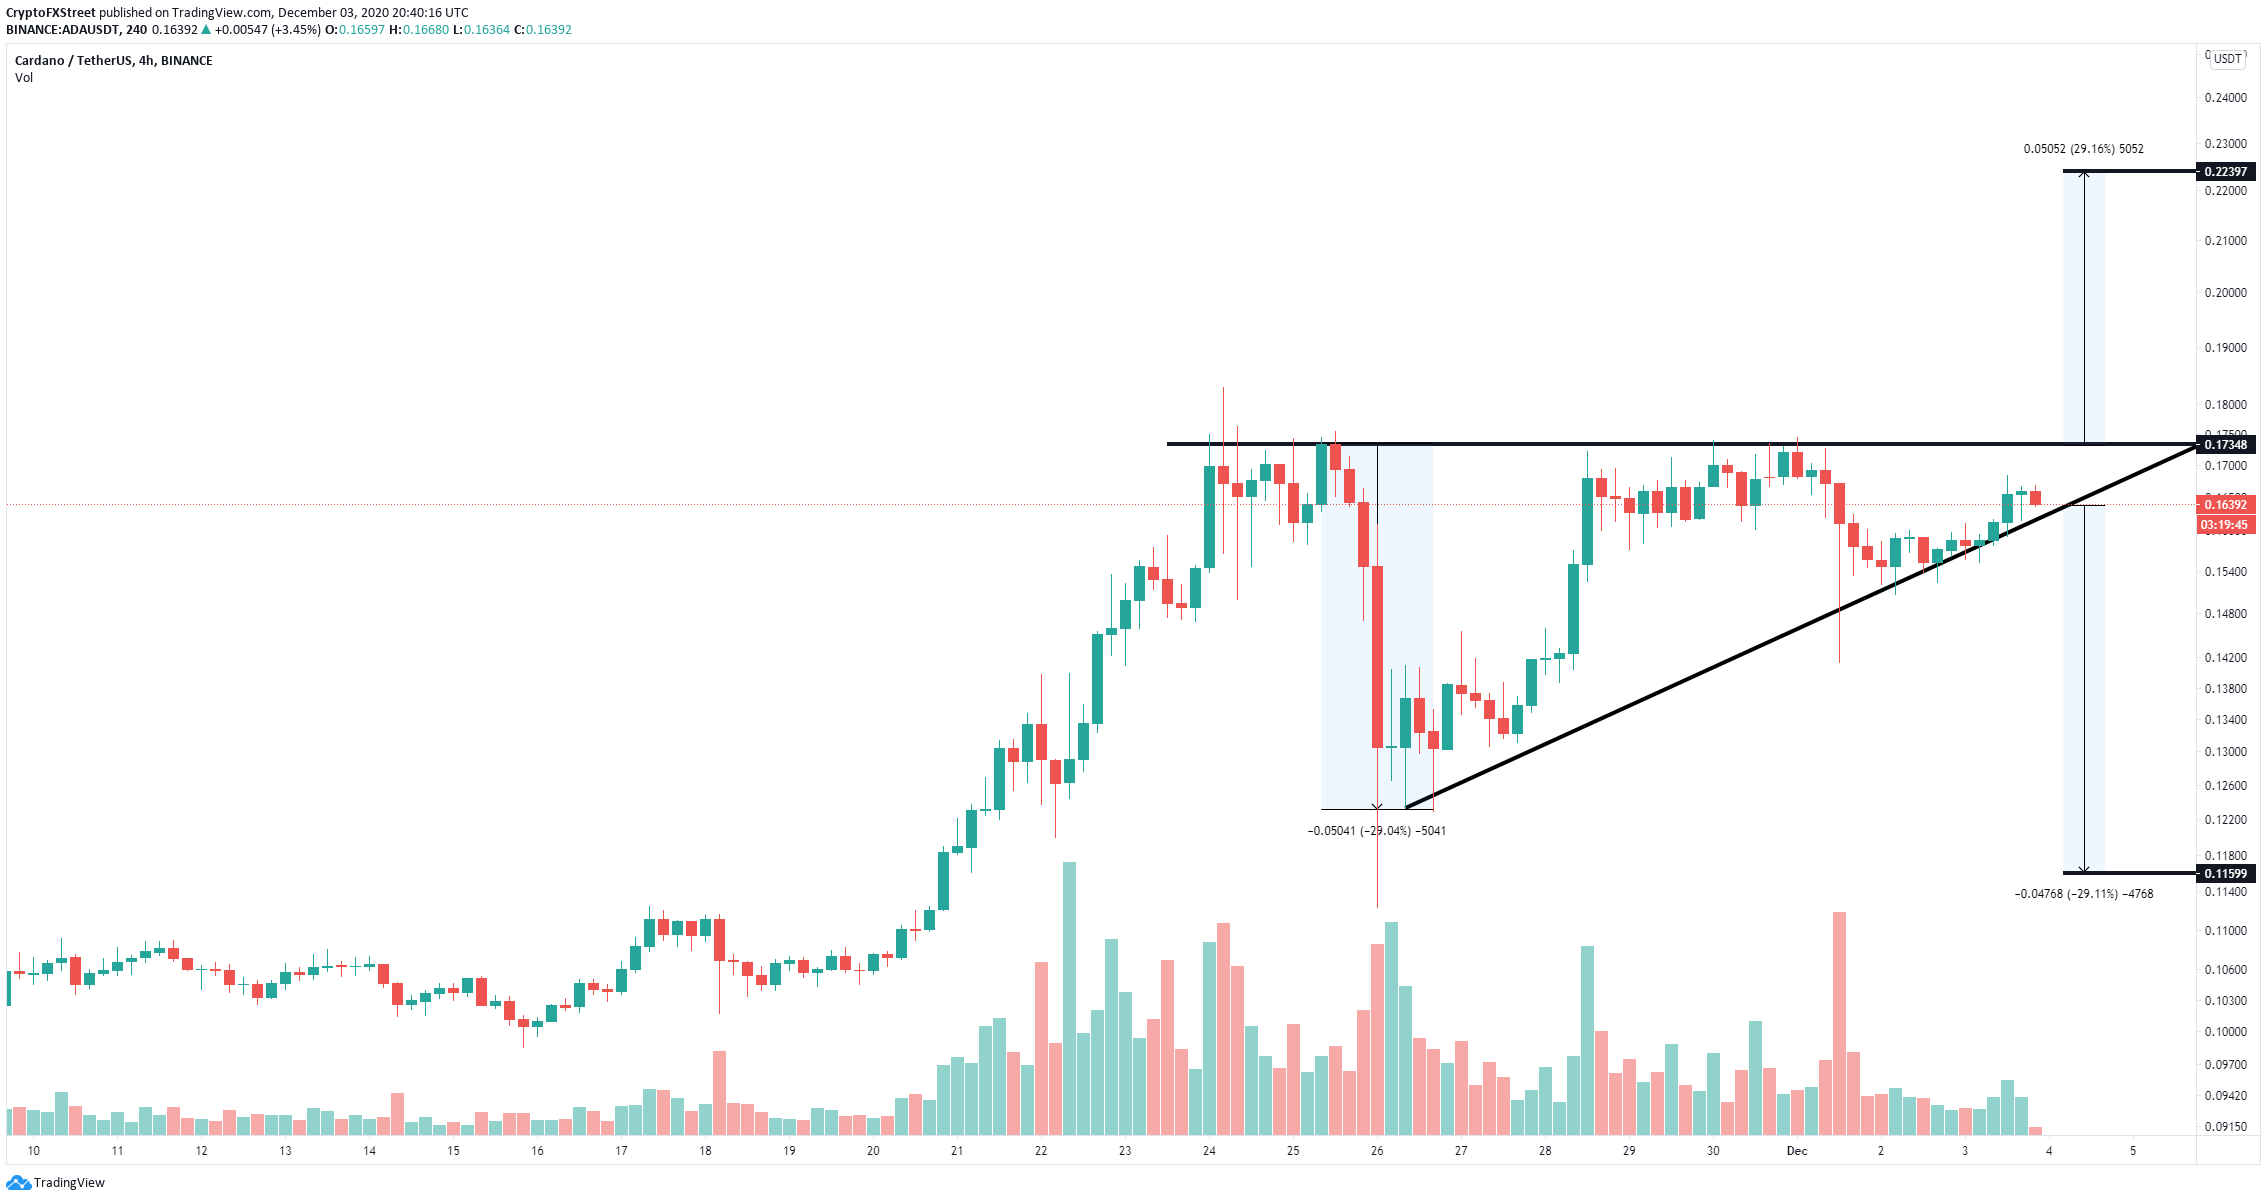
- Cardano price is contained inside an ascending triangle pattern on the 4-hour chart, ready to burst.
- The breakout or breakdown will most likely drive ADA by 30% in the long-term.
Cardano has been trading relatively sideways for the past four days consolidating from its 2020-high at $0.183. The digital asset seems to be ready for a massive price move as bears and bulls continue fighting.
Cardano is on the verge of a huge move, but in which direction?
It seems that Cardano has formed an ascending triangle pattern on the 4-hour chart which is extremely close to a breakout or breakdown. So far, the bulls have defended the 50-SMA as support which means they are strong.
ADA/USD 4-hour chart
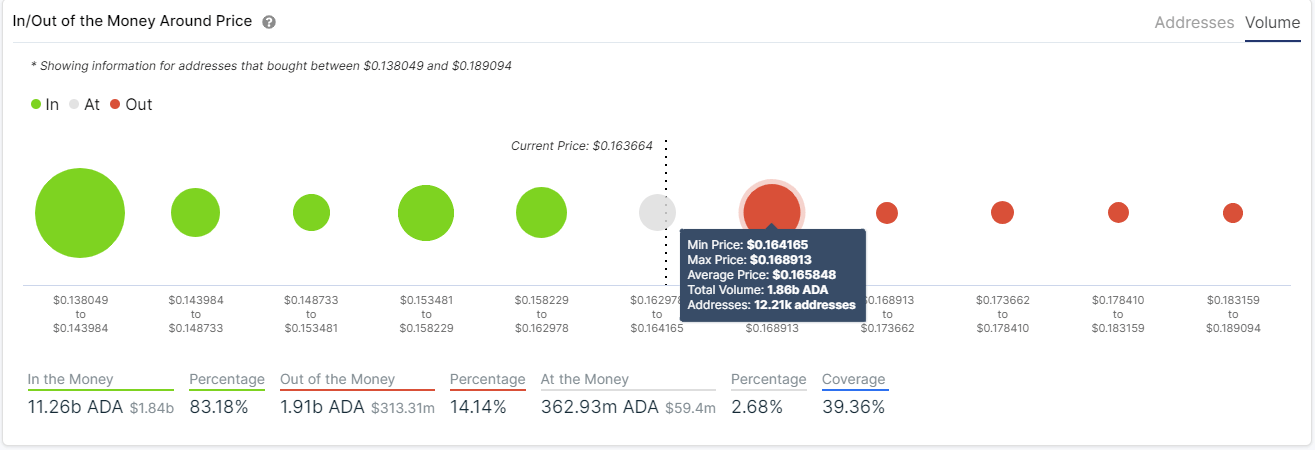
The In/Out of the Money Around Price chart (IOMAP) only shows one significant resistance area between $0.164 and $0.168, but the upper trendline of the pattern is at $0.173. This seems to indicate that climbing above $0.168 can quickly drive Cardano price to the upper boundary of the triangle and break out easily, targeting $0.223.
ADA IOMAP chart
On the other hand, the same chart also shows very little support on the way down and the current Cardano price at $0.163 is close to the lower boundary of the pattern. A breakdown below this point can push ADA price towards $0.115 in the long-term.


