- ADA is currently trading at $0.11, and numerous indicators show that bulls have a lot of strength.
- There is only one major resistance barrier stopping ADA from climbing to $0.13.
Cardano is the 9th largest cryptocurrency by market capitalization, with $3.4 billion. Over the past week, this number grew by around $600 million. Similarly, the 24 hours average trading volume also exploded in the past several days, currently at $869 million.
Cardano needs to crack this resistance point
There are several indicators in favor of ADA currently. As mentioned above, the significant increase in trading volume while the price continues climbing is a positive factor for the bulls. Additionally, on the daily chart, the MACD has remained bullish, and it’s, in fact, rising. The SAR also turned bullish, indicating that the direction of the trend is upward.
ADA/USDT daily chart
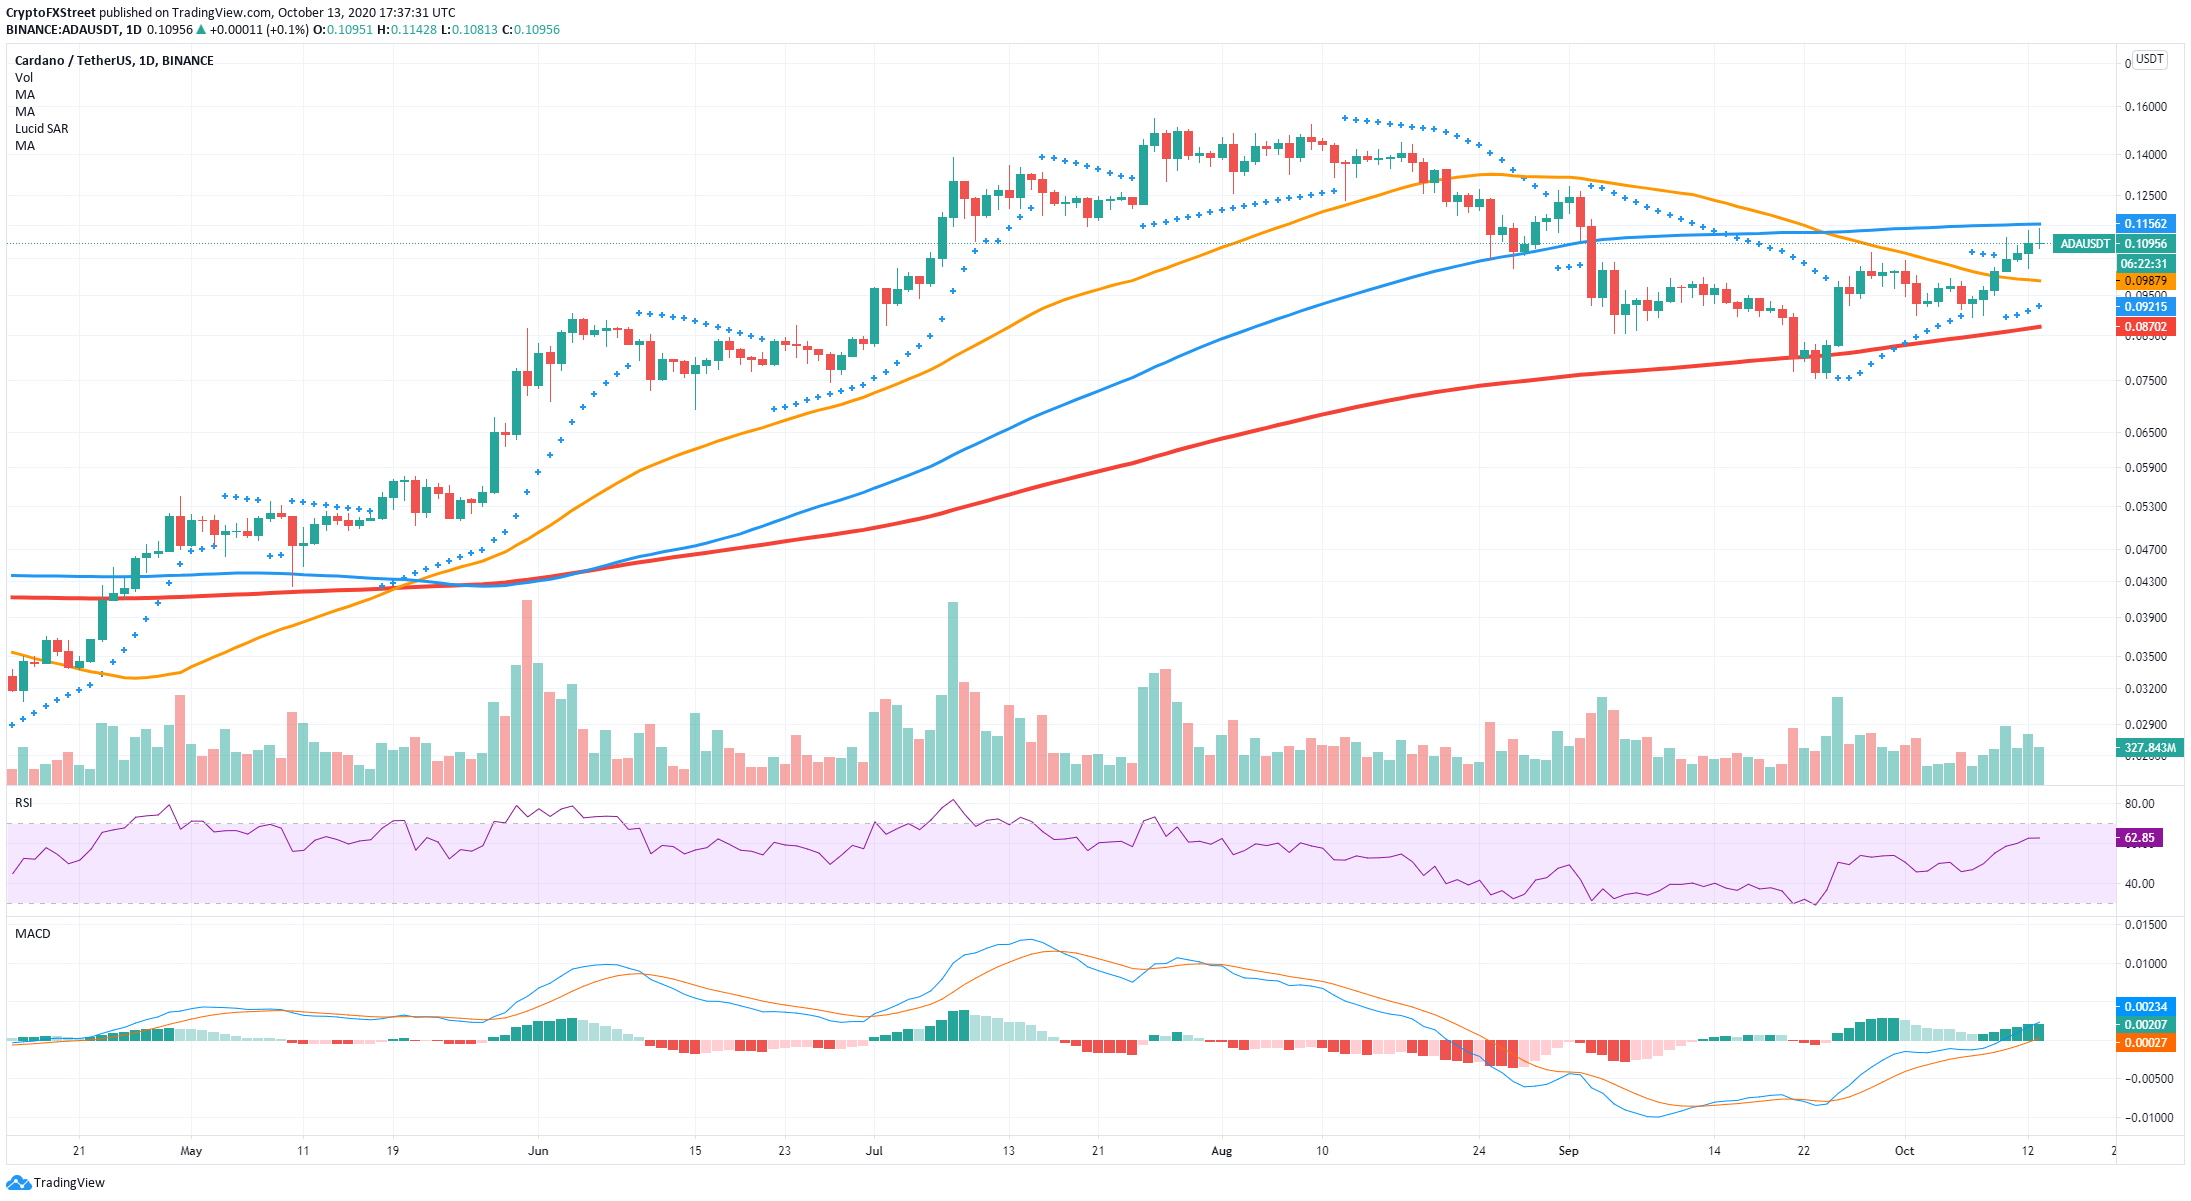
The 50-SMA was turned into a support level on October 9, and although the RSI is rapidly climbing, it is still not overbought just yet. The only resistance point in the way is the 100-SMA at $0.1156. A breakout above this point can quickly push the digital asset up to $0.13.
ADA IOMAP Chart
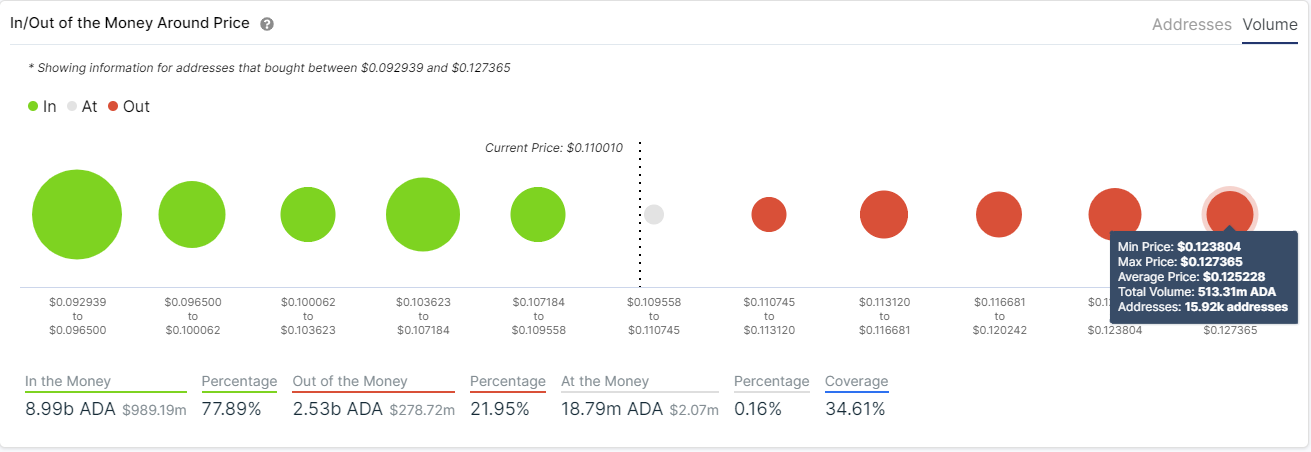
The In/Out of the Money Around Price chart by IntoTheBlock seems to confirm this theory, showing low resistance ahead when compared to support. There are no significant resistance areas above $0.115. The volume of ADA coins between $0.103 and $0.109 is around 3 billion, higher than the volume between $0.11 and $0.127.
ADA/USDT 12-hour chart
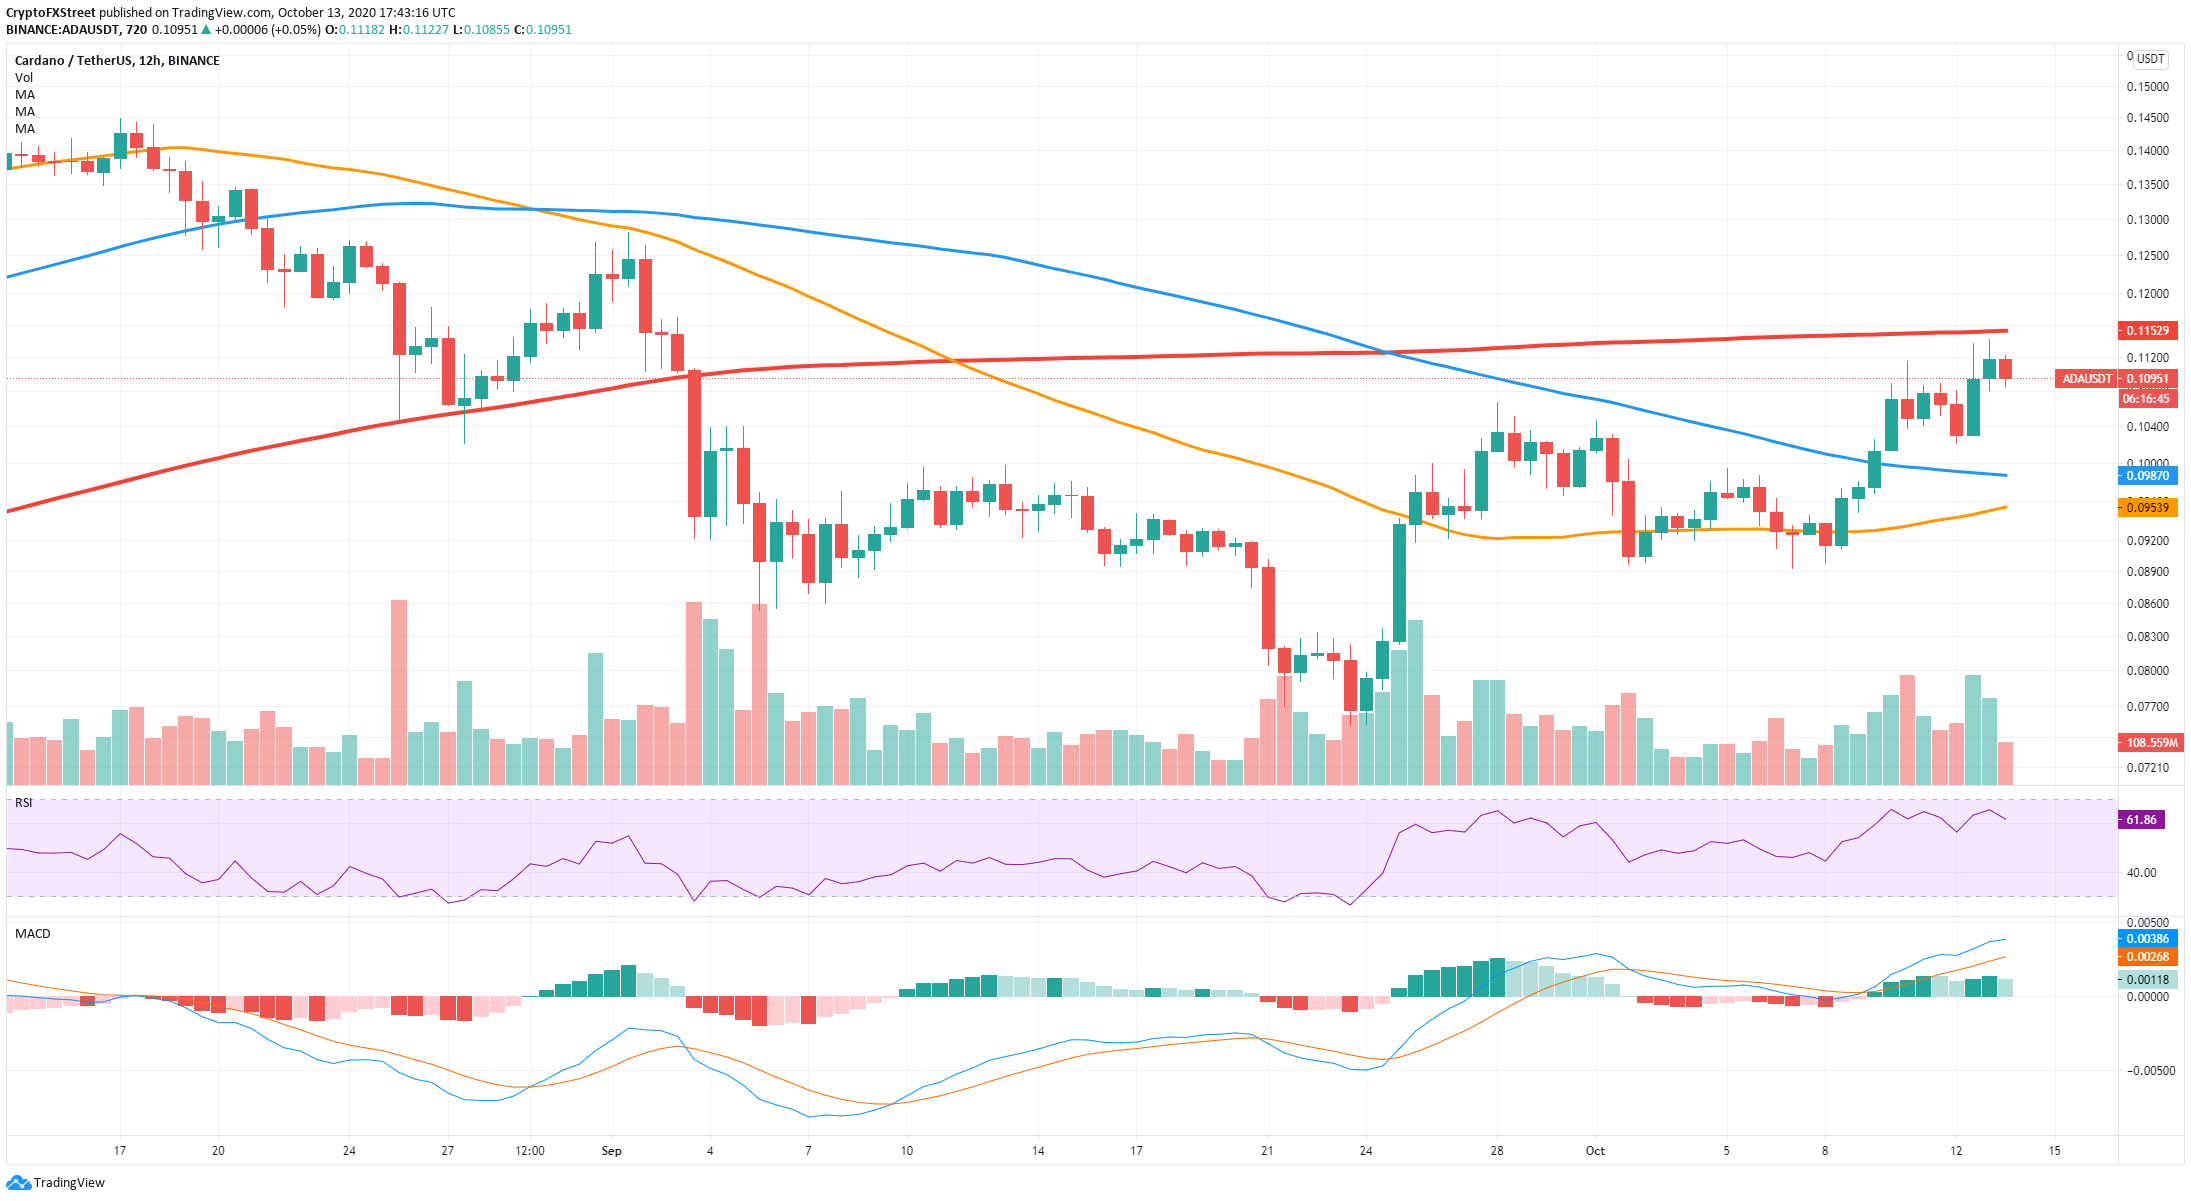
We see a similar story on the 12-hour chart, but instead of the 100-SMA acting as the resistance level, it’s the 200-SMA, right at $0.115. The level is basically the same, which adds more credibility to the theory that a breakout above this point will lead ADA towards $0.13.
At the same time, a rejection from the critical $0.115 level could have a crushing effect on ADA’s price. The 100-SMA on the 12-hour chart at $0.098 would be the next support level and the bears’ target price in the case of a rejection.
ADA New Addresses Chart
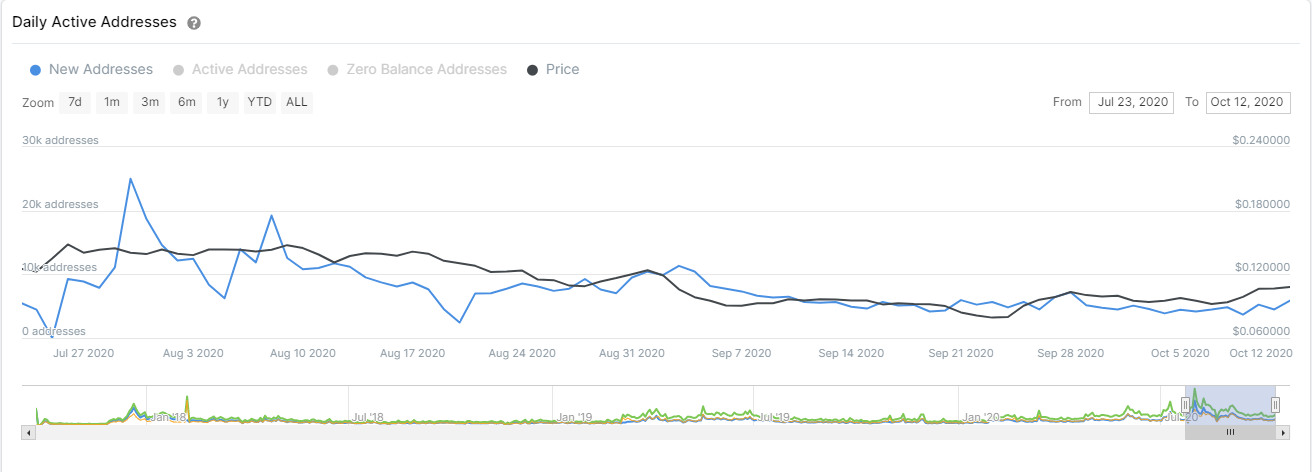
There is also a concerning trend for Cardano over the past two months. Looking at the number of new addresses joining the network, we can observe a clear spike on July 30 at 25,000, but a decline ever since to only 5,860 now. Although this number has increased slightly in the past few days, the overall downtrend is still intact.
Crucial points to keep in mind
There is a single hurdle in the way of $0.13 for Cardano bulls. The 100-SMA on the daily chart coinciding with the 200-SMA on the 12-hour chart at $0.115 is the level that needs to be cracked. A breakout will push the digital asset towards $0.13.
On the other side, there is a concerning downtrend in the number of new addresses joining the network. Rejection from the same critical level on the upside at $0.115 can lead Cardano towards the next support level at $0.098, where the 100-SMA was established on the 12-hour chart.
