- LINK is currently trading at $8.80 after a notable rebound from the low at $7.31
- ChainLink is down 56% since its peak at $20.
ChainLink has established a robust daily downtrend with bulls unable to come back. The digital asset is still up almost 500% since its 2020-low at $1.51.
LINK/USD daily chart
-637365546157428104.png)
LINK price has been rejected from the 12-EMA several times now. The most recent bounce happened at $7.31, a level close to the crucial support level of $7. LINK is trading at $8.8 after a slight rejection from $9.
LINK IOMAP Chart
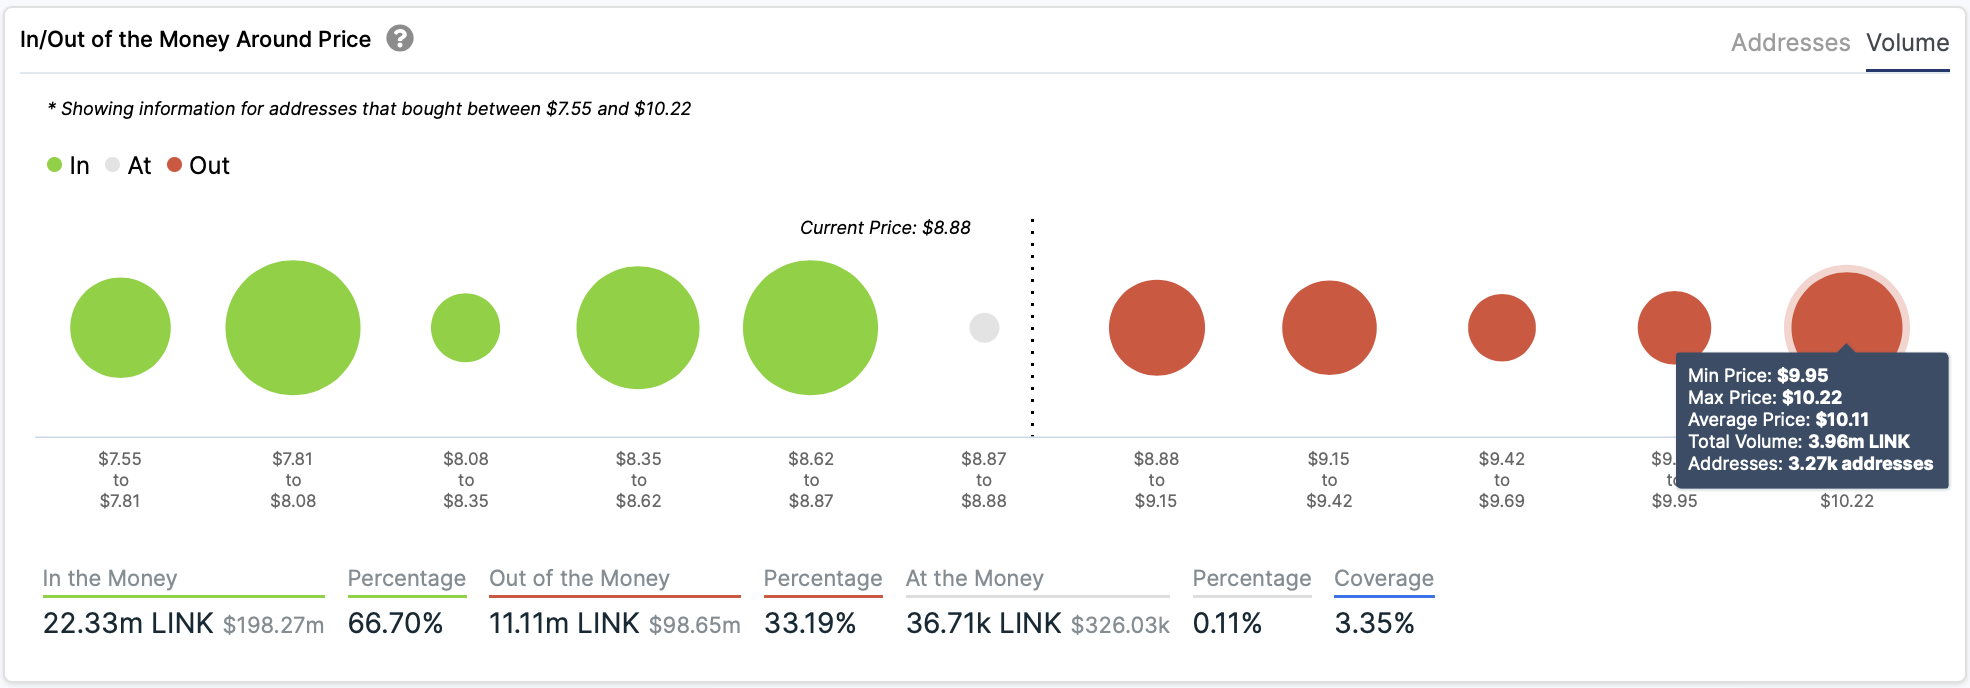
Looking at the In/Out of the Money Around Price chart by IntoTheBlock, we can observe that a large number of investors bought at $10, which creates a healthy resistance level. At the same time, many investors also got in at $8.8, $8.6, and $8. The area at $8 and above represents a strong support level.
Bulls are eying up $10 as the next resistance level, which coincides with the 12-EMA at $9.8 currently. The MACD remains bearish but could turn bullish within the next few days if the momentum continues favoring buyers.
LINK/USD 4-hour chart
-637365546289000829.png)
On the 4-hour chart, LINK price managed to climb above the 12-EMA and could turn it into support in the short-term. The MACD flipped bullishly, and the trend is slowly shifting in favor of the bulls.
However, a bearish breakout below $8 would be devastating as there aren’t many support levels below it. If $8 cracks, LINK will re-test the low of $7.31.
On the other hand, if bullish momentum continues, we could see LINK re-test $10 as the next most crucial resistance level.
