- LINK is currently trading at $10.79, and it’s down around 47% since its all-time high.
- According to various metrics, LINK whales are still buying many coins in the past three months.
ChainLink hit a new all-time high at $20.11 on August 16 and was outperforming the market by a lot. Unfortunately, the selling pressure eventually hit LINK, which has seen a notable pullback towards $9.1.
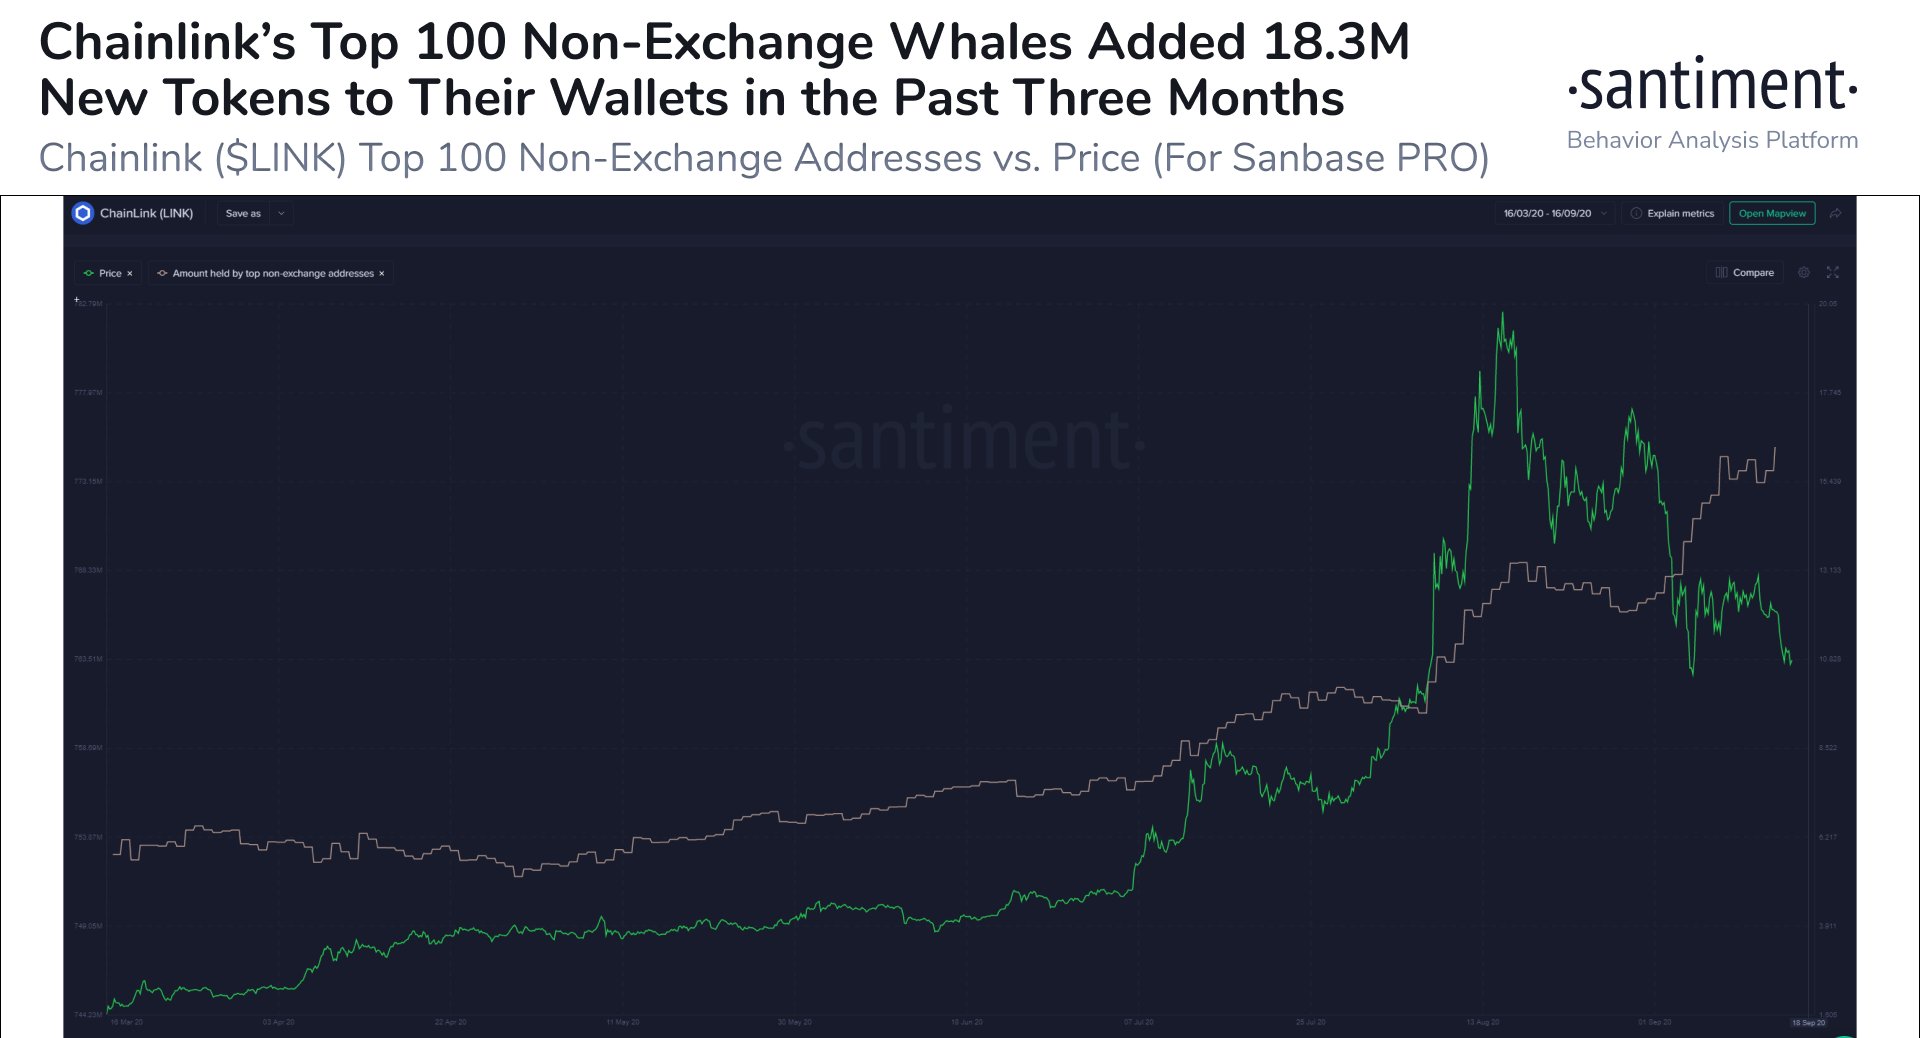
According to a recent report by Santiment, it seems that LINK’s top 100 non-exchange whale addresses have added around 18.3 million tokens to their wallets, approximately $200 million at current prices, in the past three months. This fact is notable because LINK lost almost 50% of its value in the past month alone.
LINK/USD daily chart
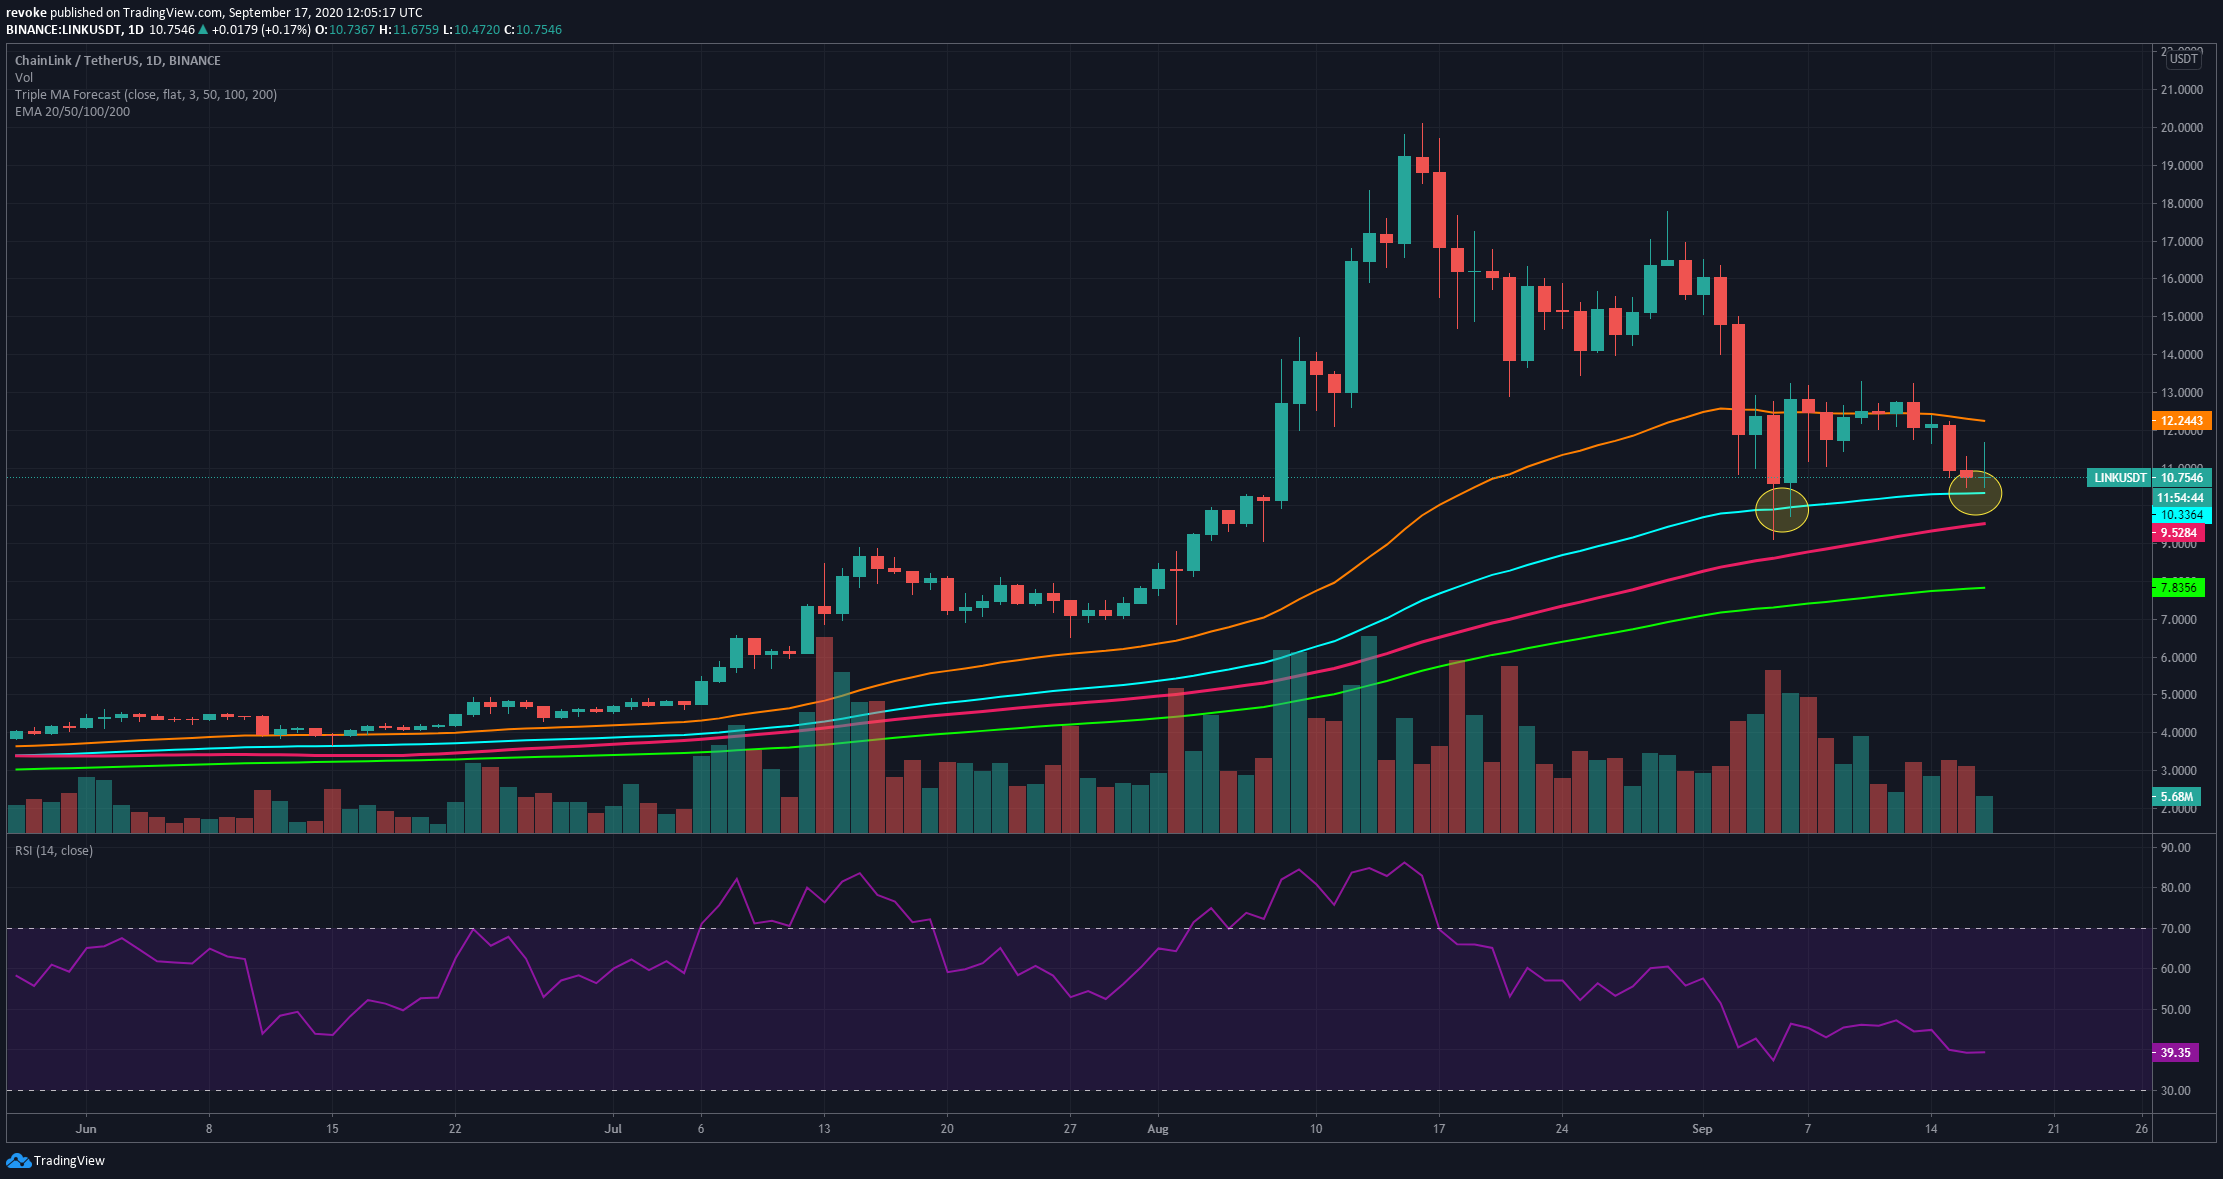
It seems that the 100-EMA has been acting as a strong support level for LINK in the past two weeks, even though the price did pierce this support twice on September 5 and 6. Further down, bulls can find more support in the form of the 50-MA at $9.52 and the low at $9.1.
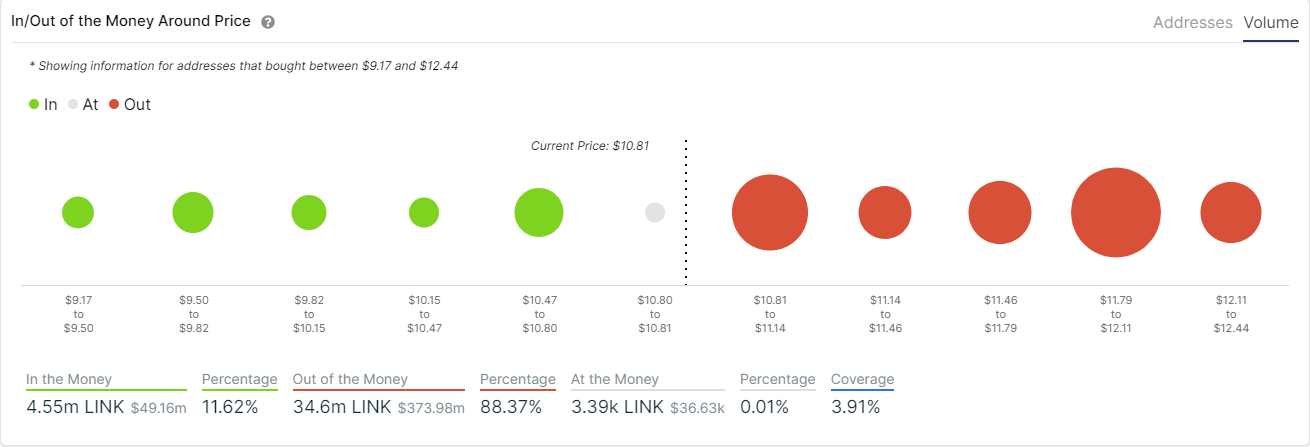
Unfortunately, looking at the IOMAP chart, the resistance encountered by the bulls is far greater than the support levels. The nearest most crucial support level is $10.63; however, this level is smaller than the $10.95 resistance.
A bearish breakout below the 100-EMA could be devastating for the price of LINK as there are almost no support levels until $7.83, the 200-EMA. On the other hand, if LINK can bounce from the 100-EMA above the 50-EMA and turn it into support, the momentum will shift in favor of the bulls despite intense resistance levels.
LINK/USD 4-hour chart
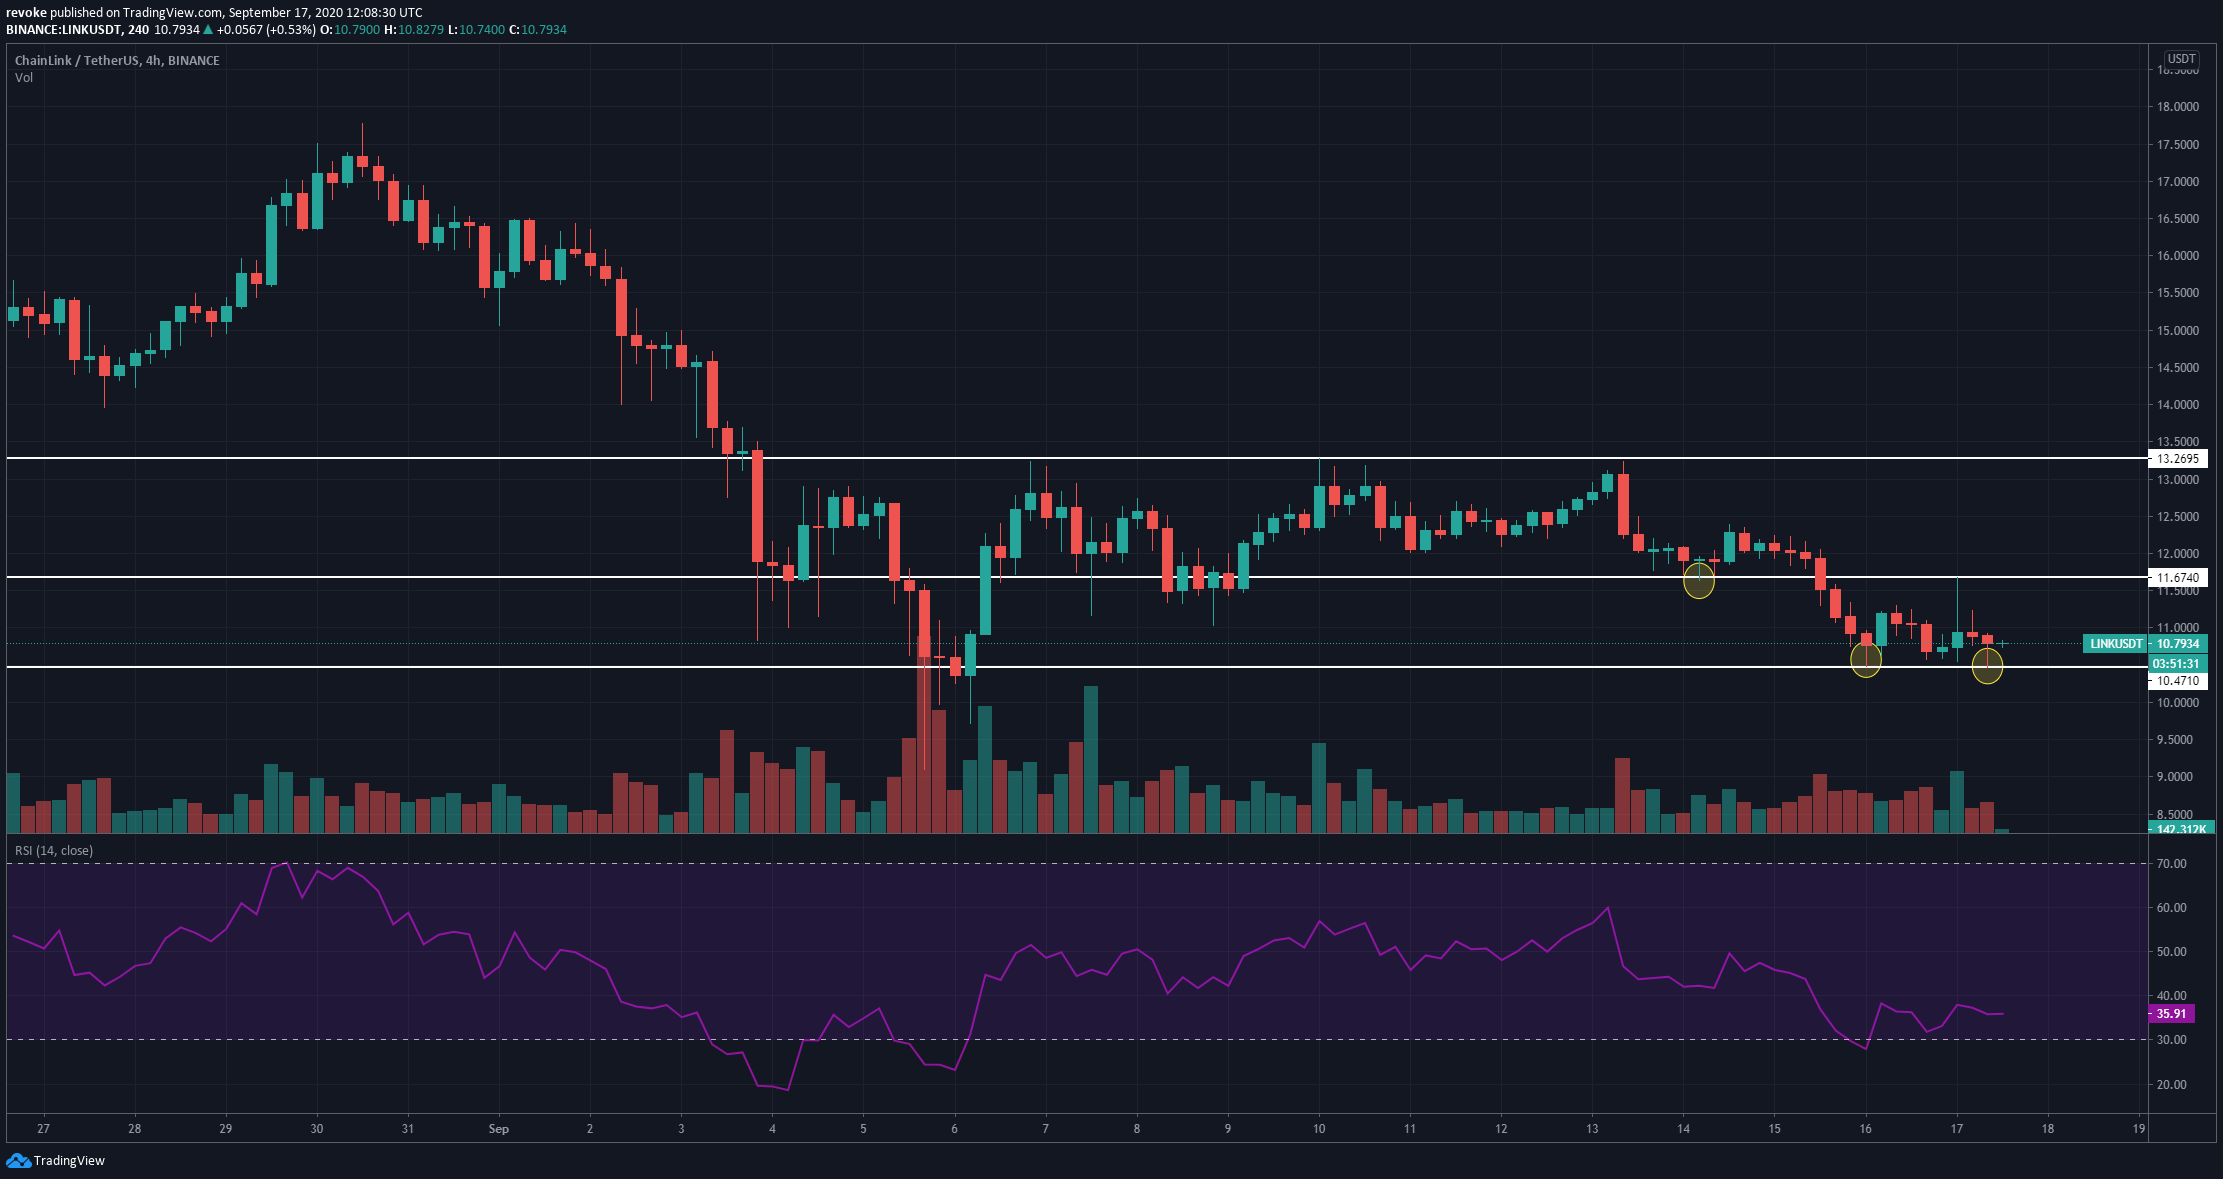
In the shorter time frame, LINK bulls have managed to hold a double bottom at $10.47, but the downtrend still stands. The next short-term resistance is $11.67 and then the high at $12.38. A breakout above this last level would represent a shift towards an uptrend; however, LINK would still face a robust resistance level at $13.28.
