- Chainlink price plummeted after a breakdown from the ascending parallel channel on the 12-hour chart.
- Bulls managed to buy the dip and push LINK back up.
Chainlink has been trading inside an ascending parallel channel for close to three months before finally seeing a massive 30% breakdown which was fairly close to the price target that we suggested in our last analysis.
Chainlink price in recovery mode, but can the bulls sustain the rebound?
After a breakdown below $12, Chainlink plummeted down to $8.05 before quickly bouncing back up within 24 hours hitting $11.88. Several days later, the digital asset formed a higher low at $10.47 and a higher high at $13.24 confirming an uptrend on the 12-hour chart.
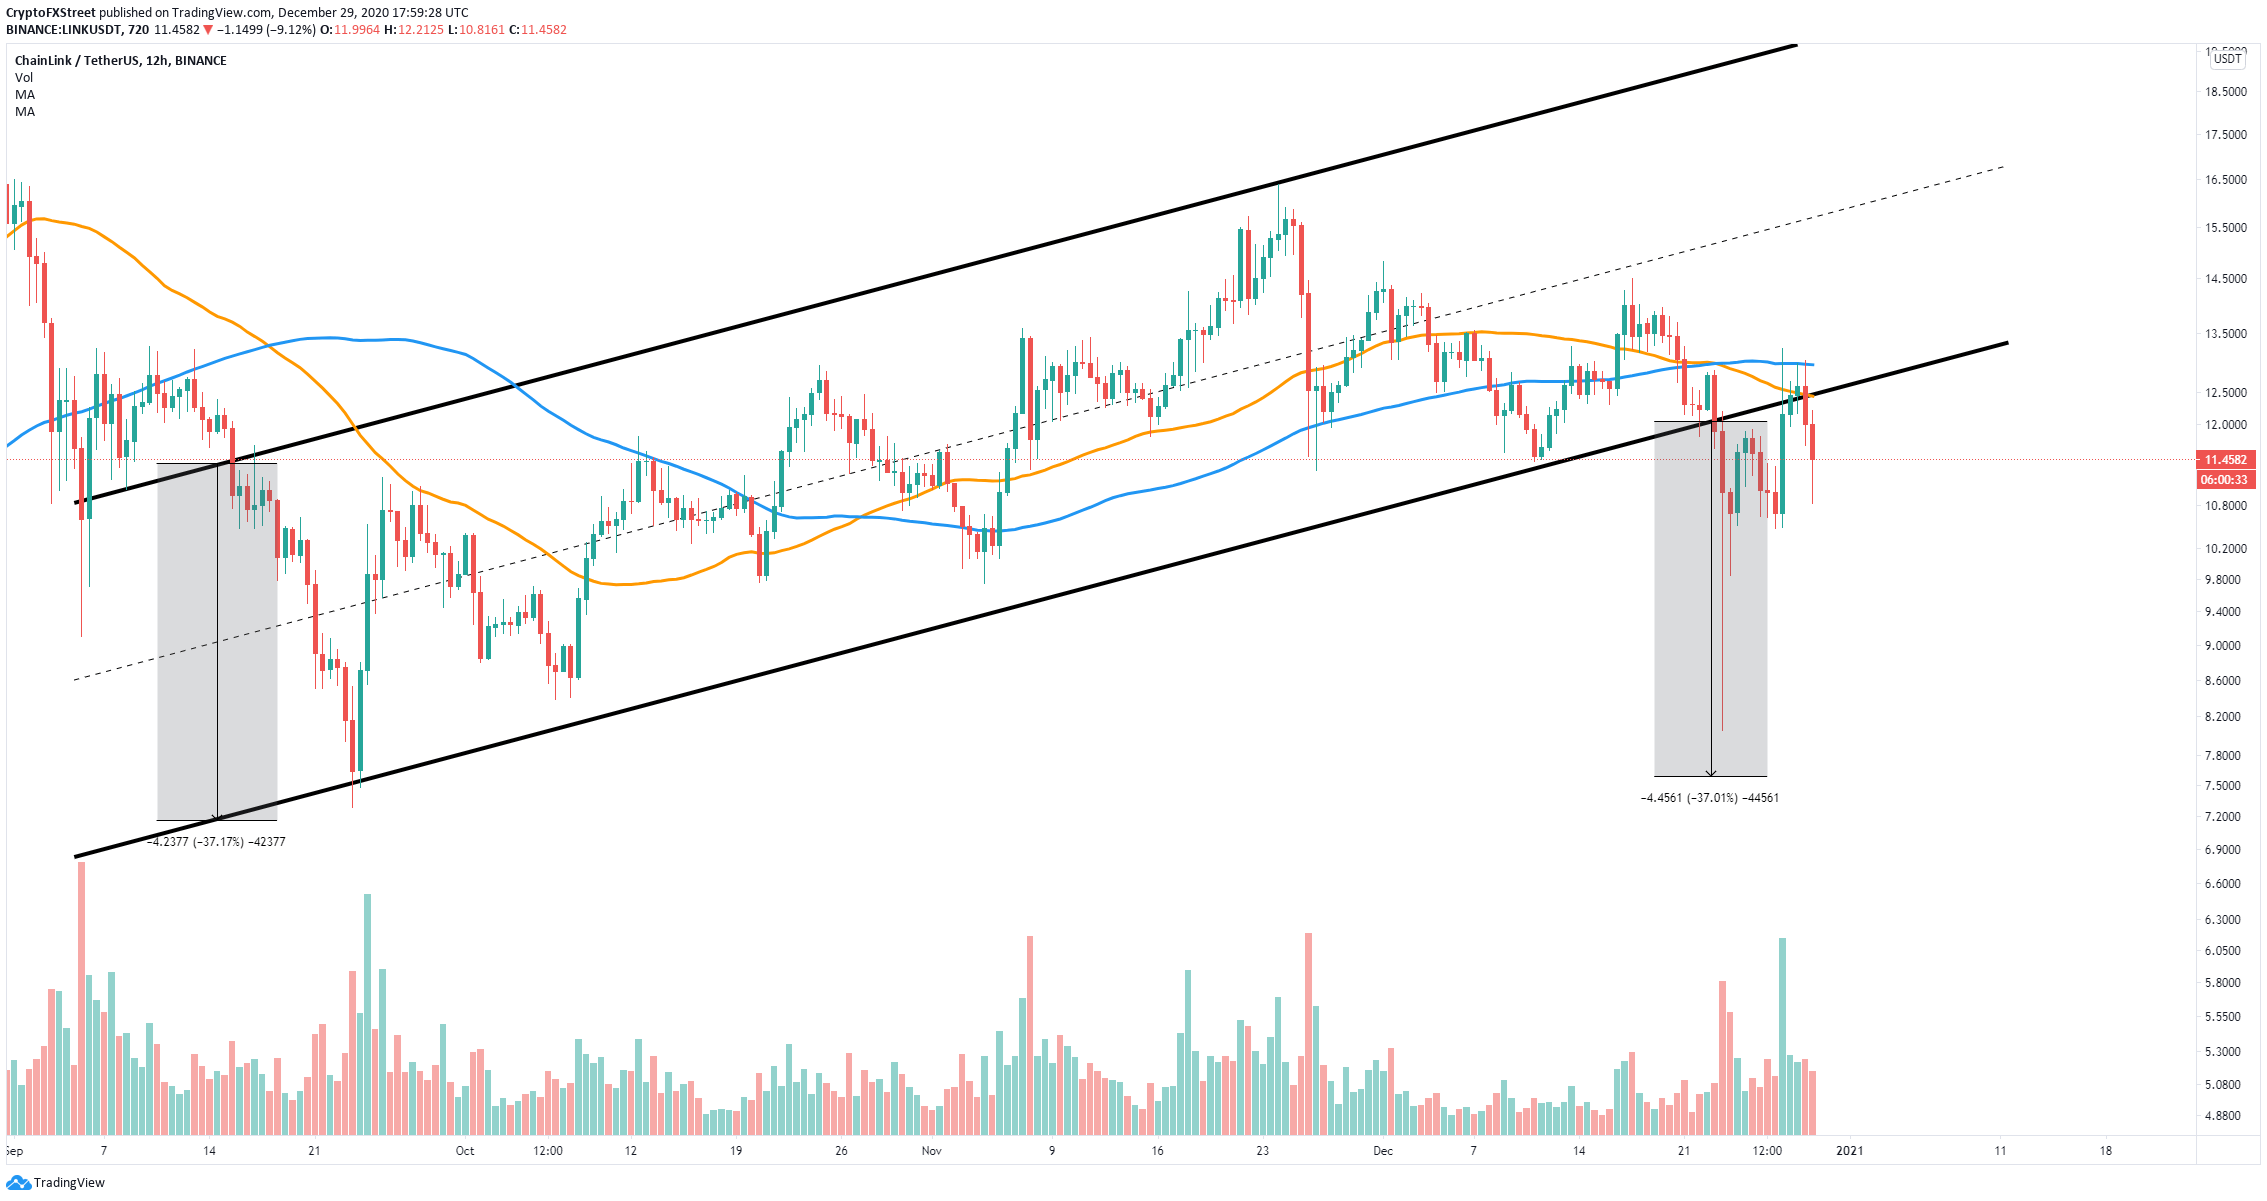
LINK/USD 12-hour chart
Now, bulls need to recover the 50-SMA and the 100-SMA levels and turn them into support points. A breakout above $12.8 can quickly drive Chainlink price towards the high of $14.5 set on December 17.

LINK IOMAP chart
The In/Out of the Money Around Price (IOMAP) chart seems to confirm this theory as it shows the strongest resistance area to be located between $12.36 and $12.73 and very little resistance above.
However, the IOMAP also shows very little support in comparison to the resistance above giving the bears the upper hand. A breakdown below $10.47 can push Chainlink price towards the last low at $8.05.
