- Chainlink price is contained inside an ascending parallel channel, trading right in the middle.
- The breakdown or breakout of this pattern will determine the future of LINK.
Chainlink is the 7th largest cryptocurrency by market capitalization at $5.4 billion, aiming to surpass Bitcoin Cash and Litecoin, which both have less than $6 billion. LINK bulls and bears wait for a clear breakout or breakdown from an ascending parallel channel formed on the 4-hour chart.
Chainlink price sits in a no-trade zone
On the 4-hour chart, LINK has established an ascending parallel channel with the upper trendline at around $17 and the lower boundary at $12. Currently, Chainlink price is right in the middle of the pattern.
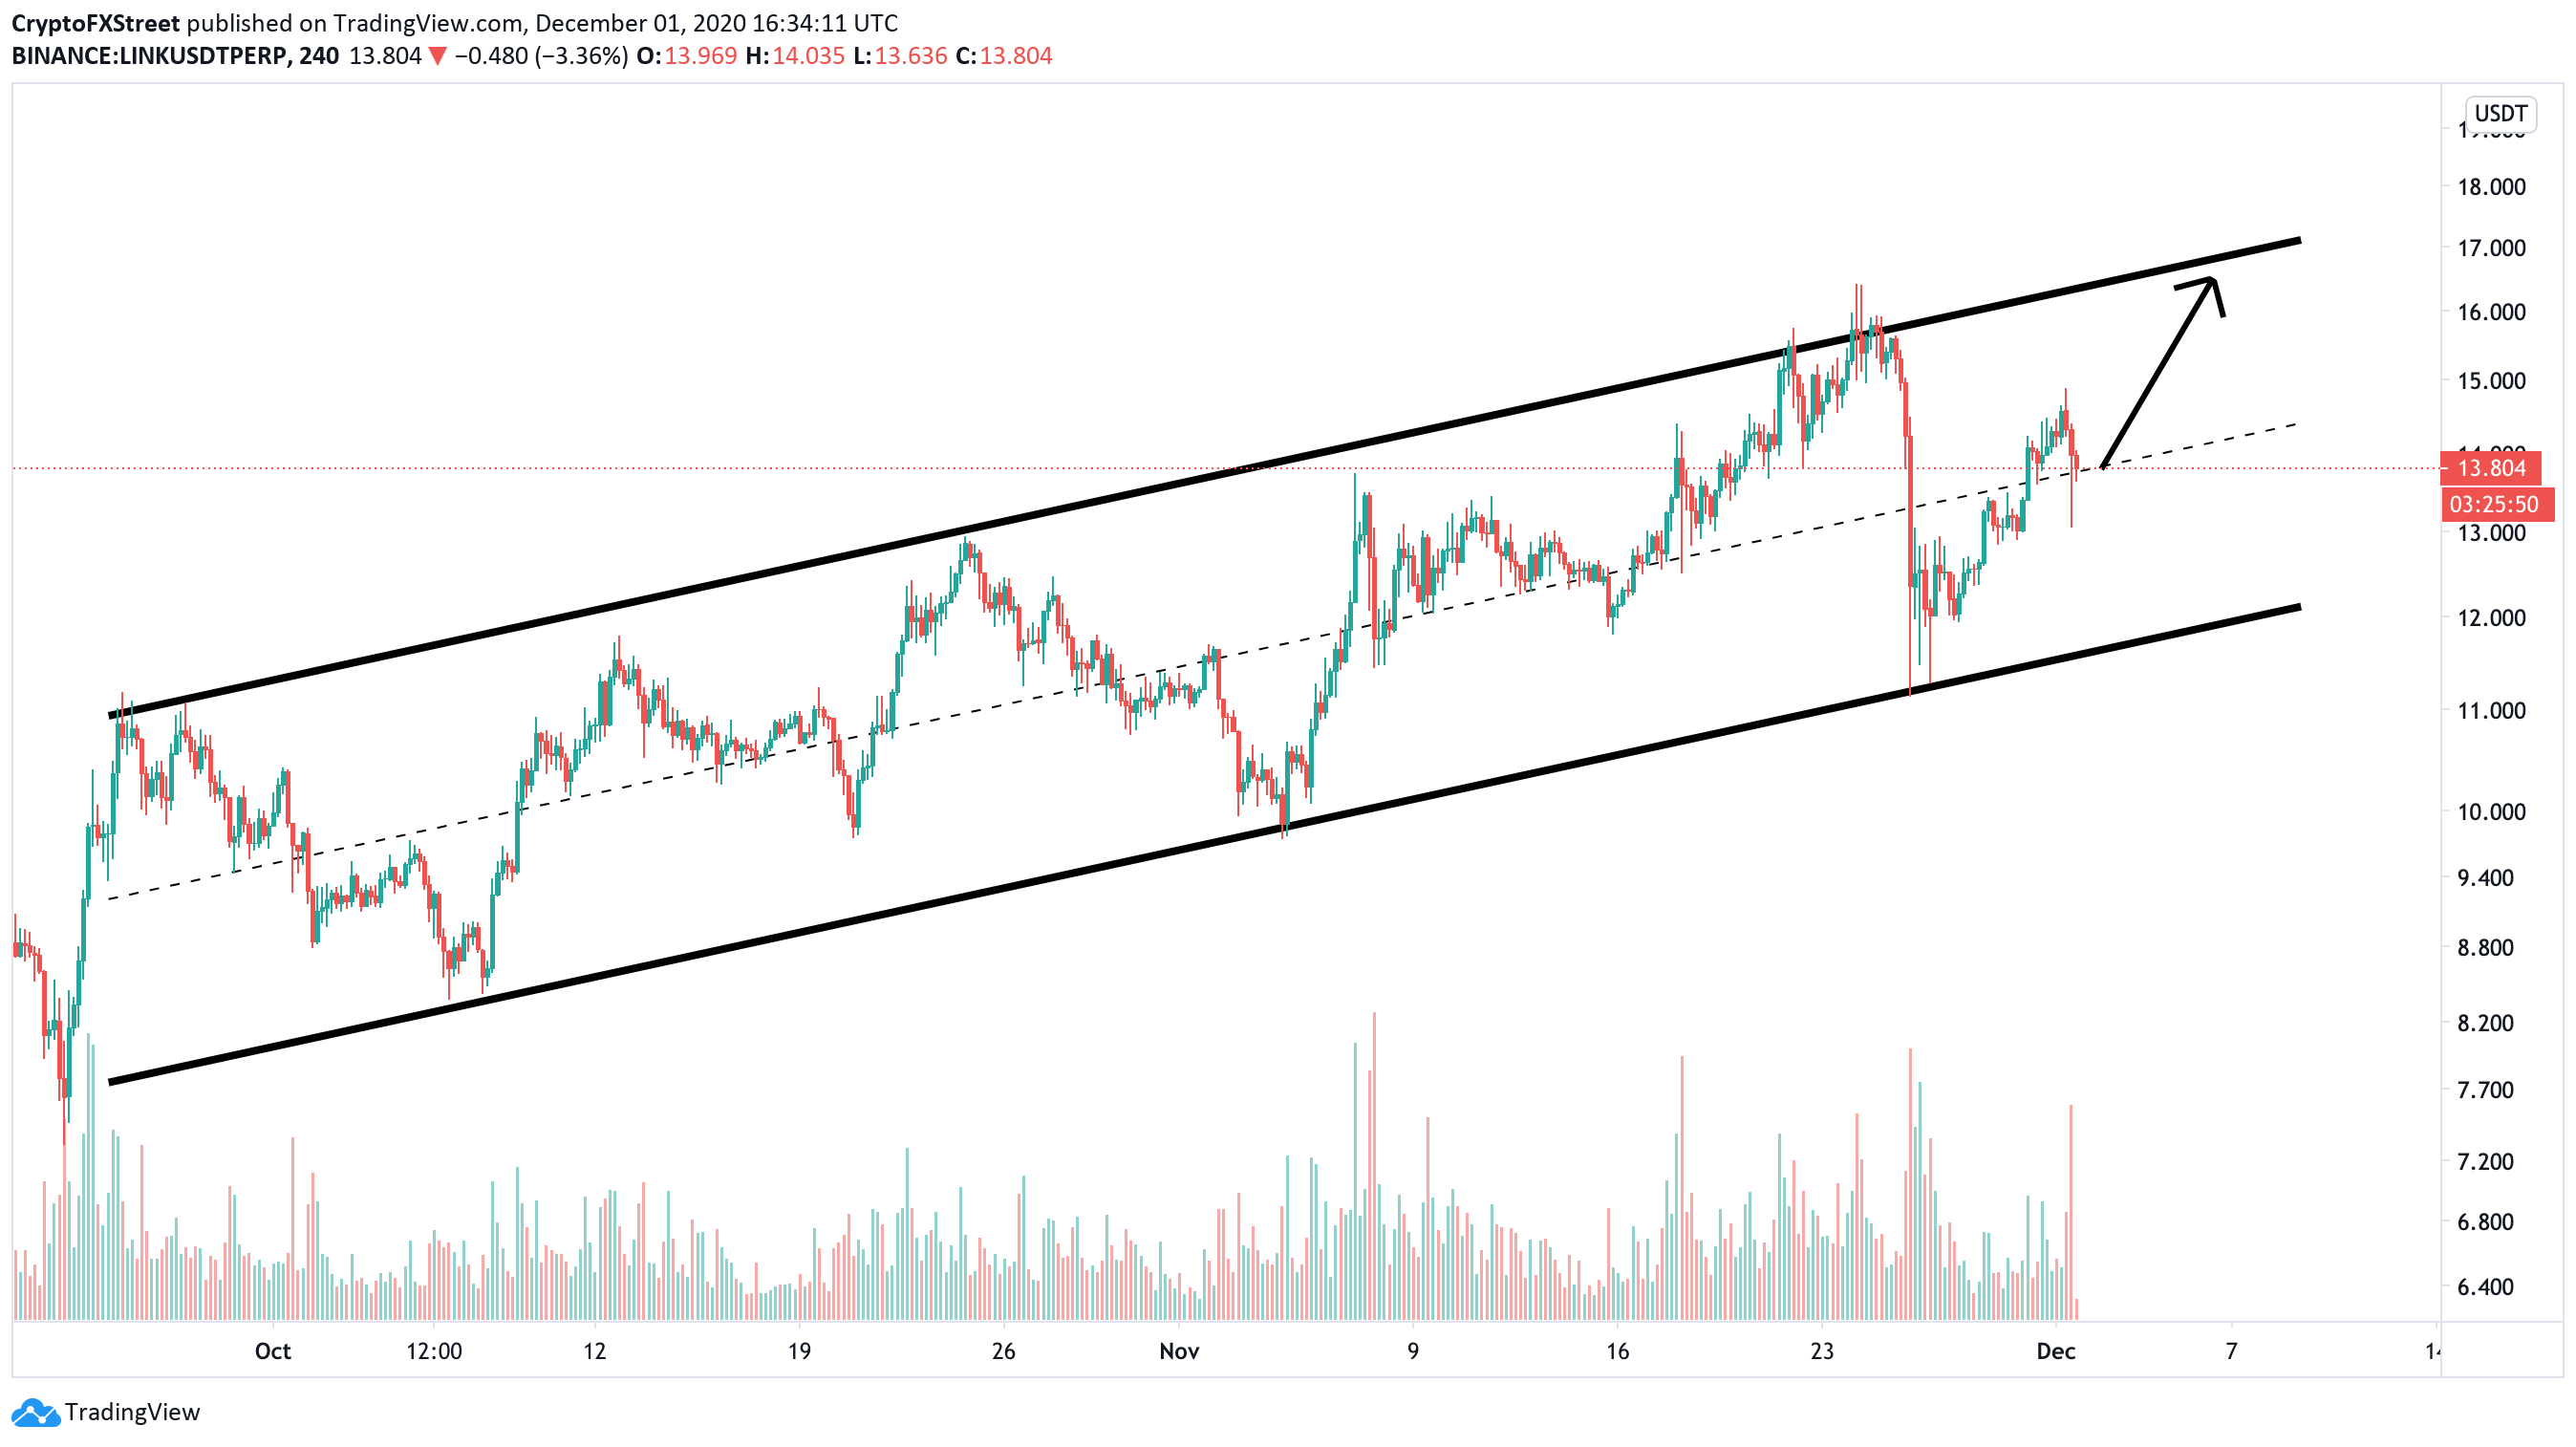
LINK/USD 4-hour chart
Rebounding from the middle of the ascending channel would drive Chainlink price to the top at around $17. On the other hand, if bulls fail to hold the middle trendline, LINK can quickly drop to the lower boundary at $12.
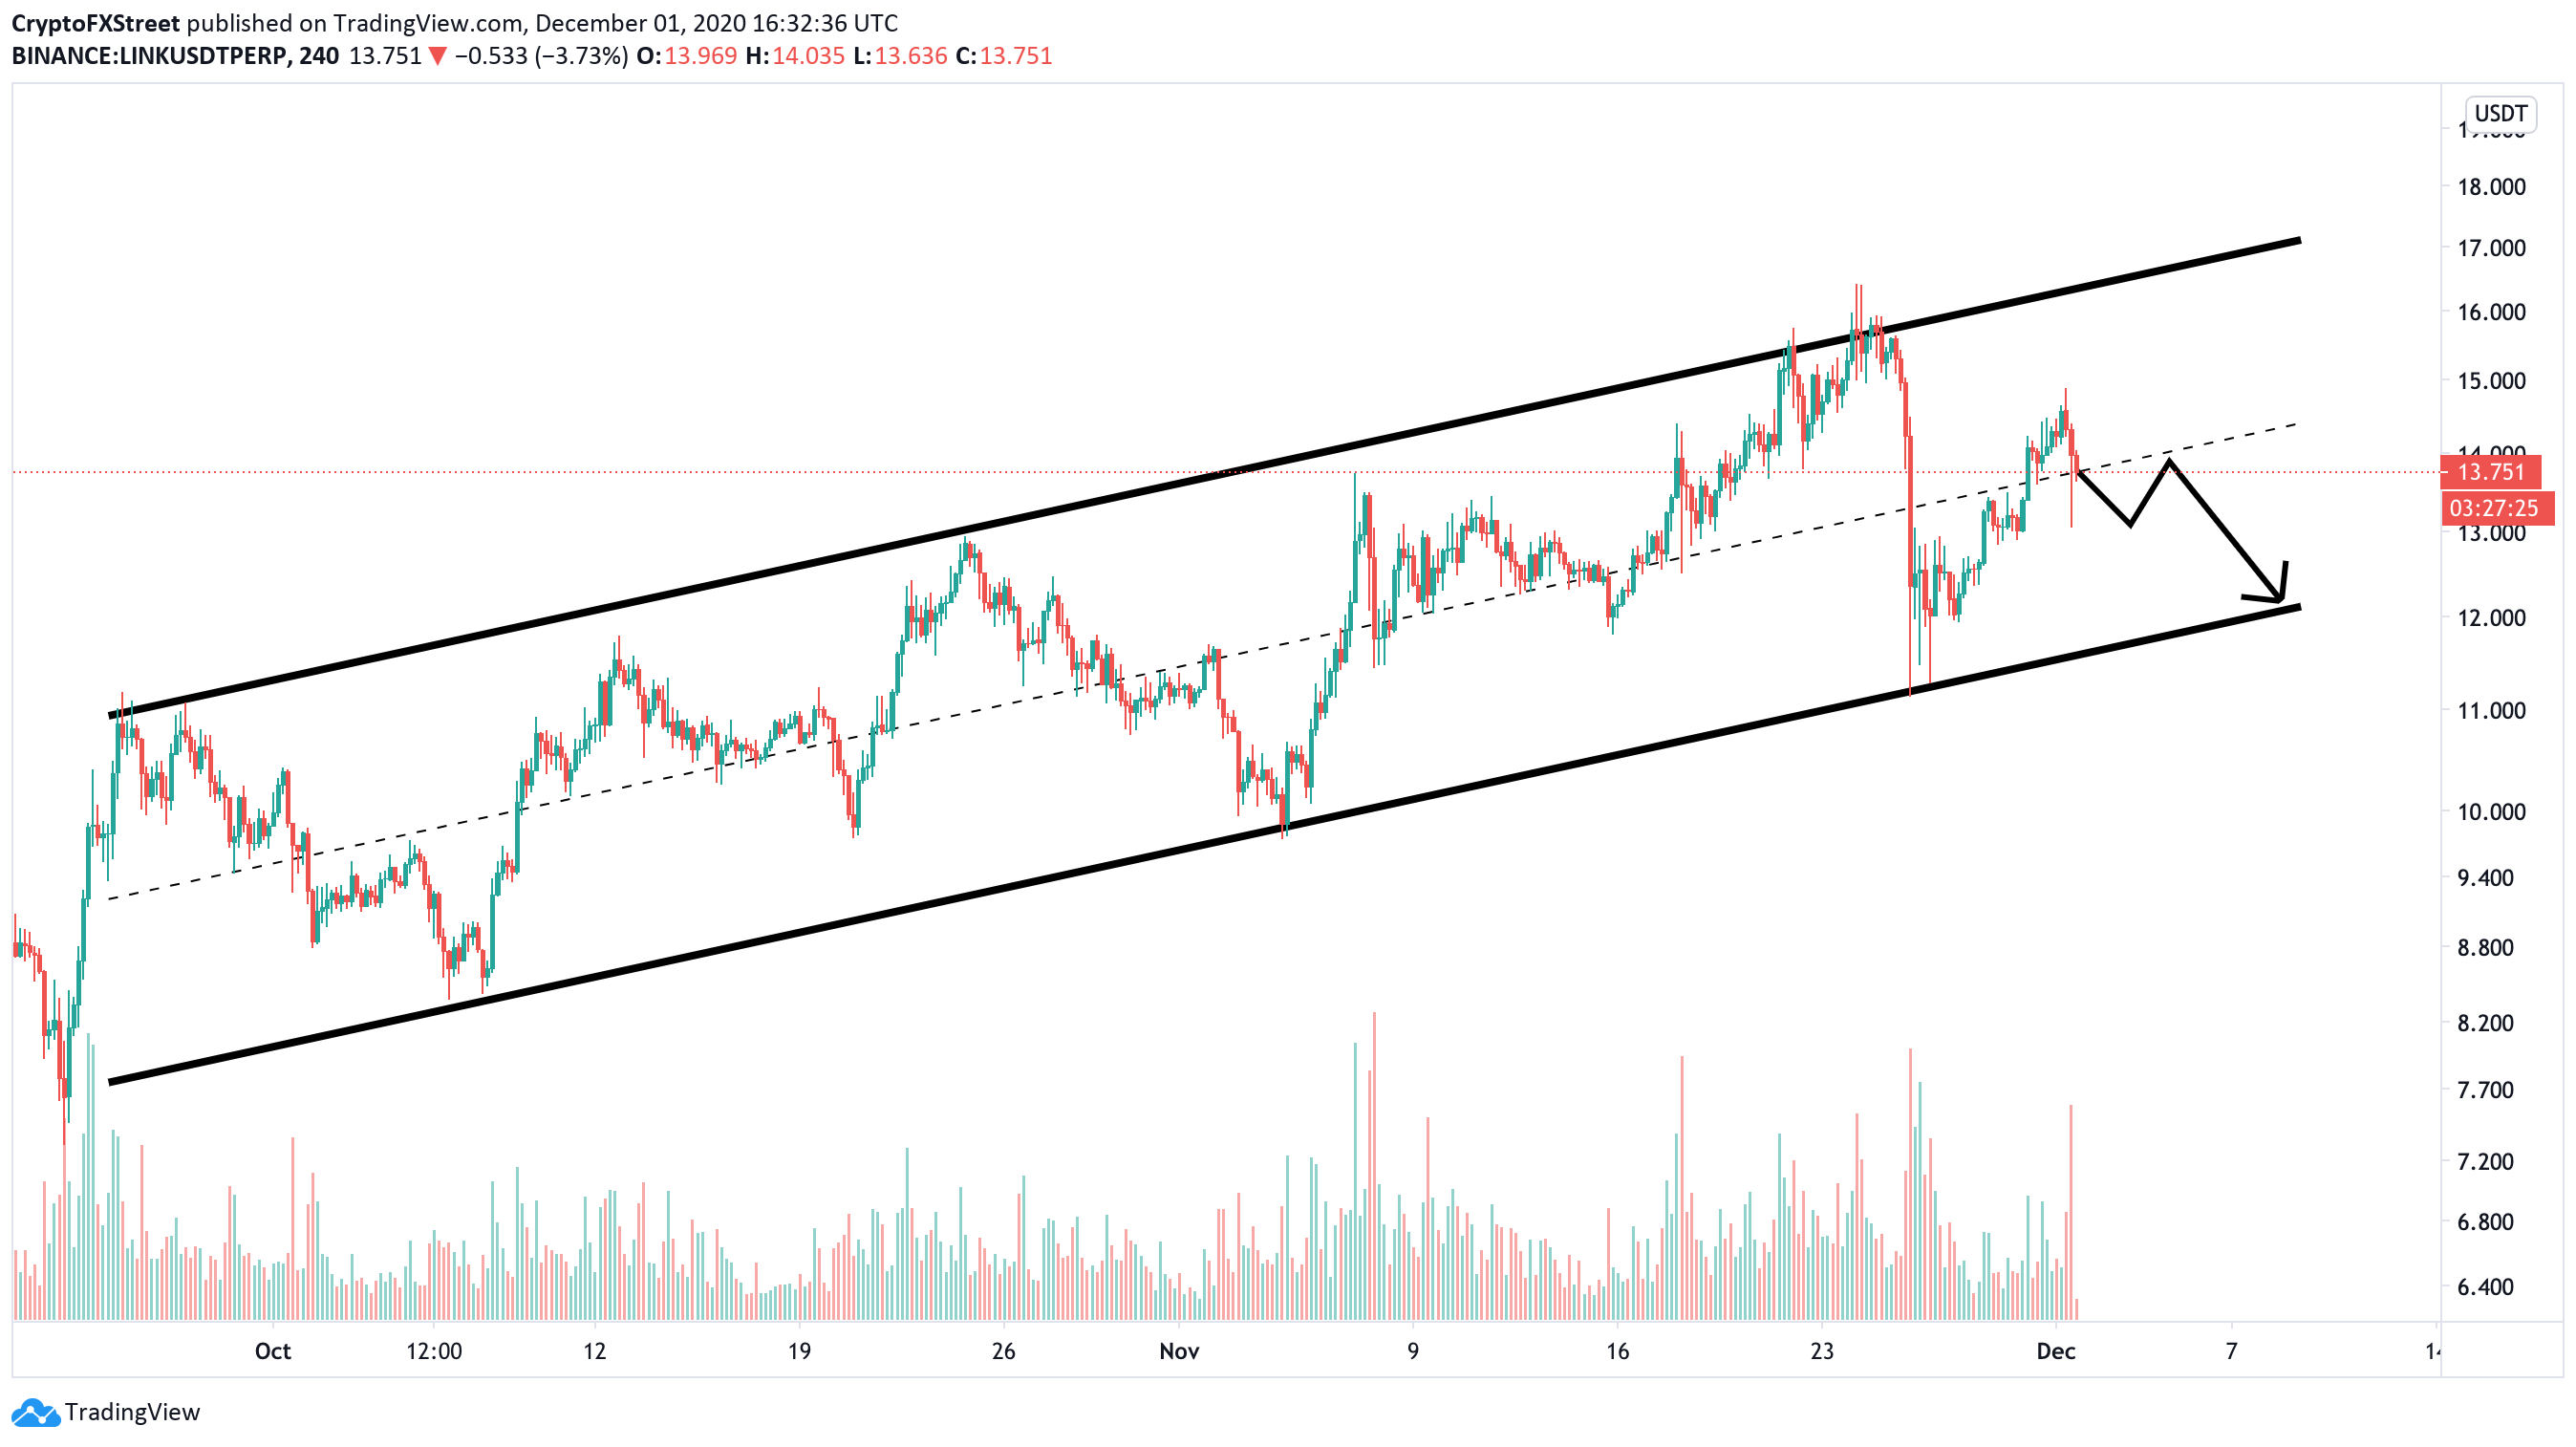
LINK/USD 4-hour chart
The most likely bearish scenario would be an initial drop followed by a potential re-test of the middle trendline into a final dip towards $12. Additionally, it seems that the TD Sequential indicator is on the verge of presenting a sell signal on the 12-hour chart.
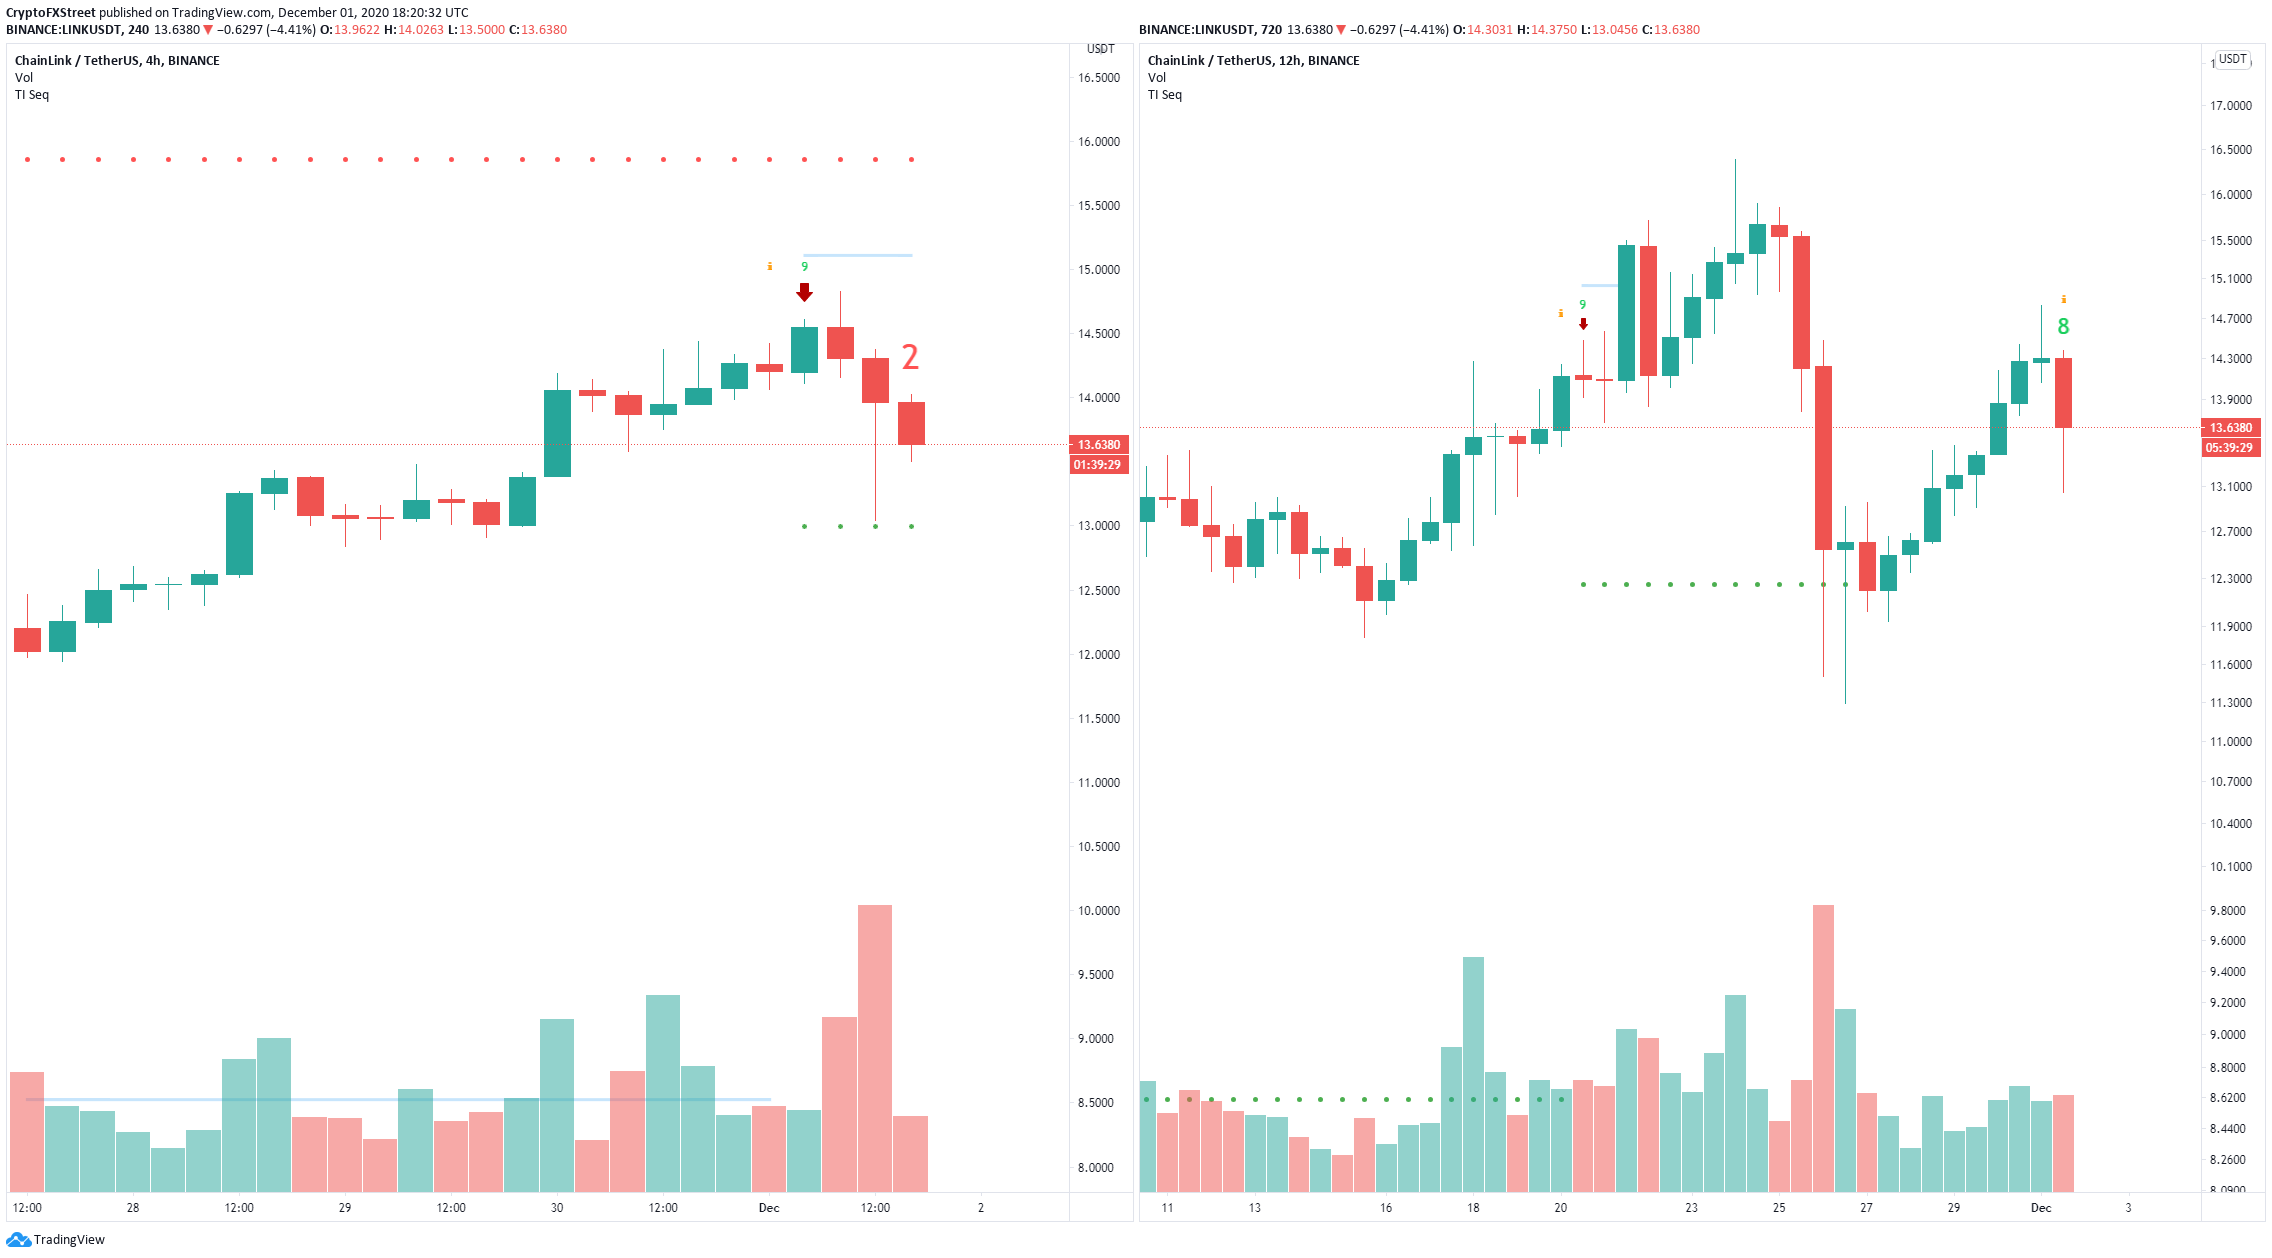
LINK/USD 4-hour and 12-hour charts
On the 4-hour chart, the TD Sequential already presented a sell signal earlier on Tuesday that got validated, which adds credence to the potential upcoming signal on the 12-hour chart.
