- The Chiliz price is contained inside a descending parallel channel on the 12-hour chart.
- The digital asset faces some resistance ahead but has significant bullish momentum behind it.
- The TD Sequential indicator has presented a buy signal on the daily chart.
The Chiliz price had a massive rebound from a critical support level at $0.38, climbing by 30% in the past three days. CHZ faces another key resistance level before a potential breakout toward $0.74.
Chiliz price aims for new leg up above $0.50
On the 12-hour chart, Chiliz has formed a descending parallel channel that can be drawn by connecting the lower highs and lower lows with two parallel trend lines. The nearest resistance level is the 50 SMA at $0.51.
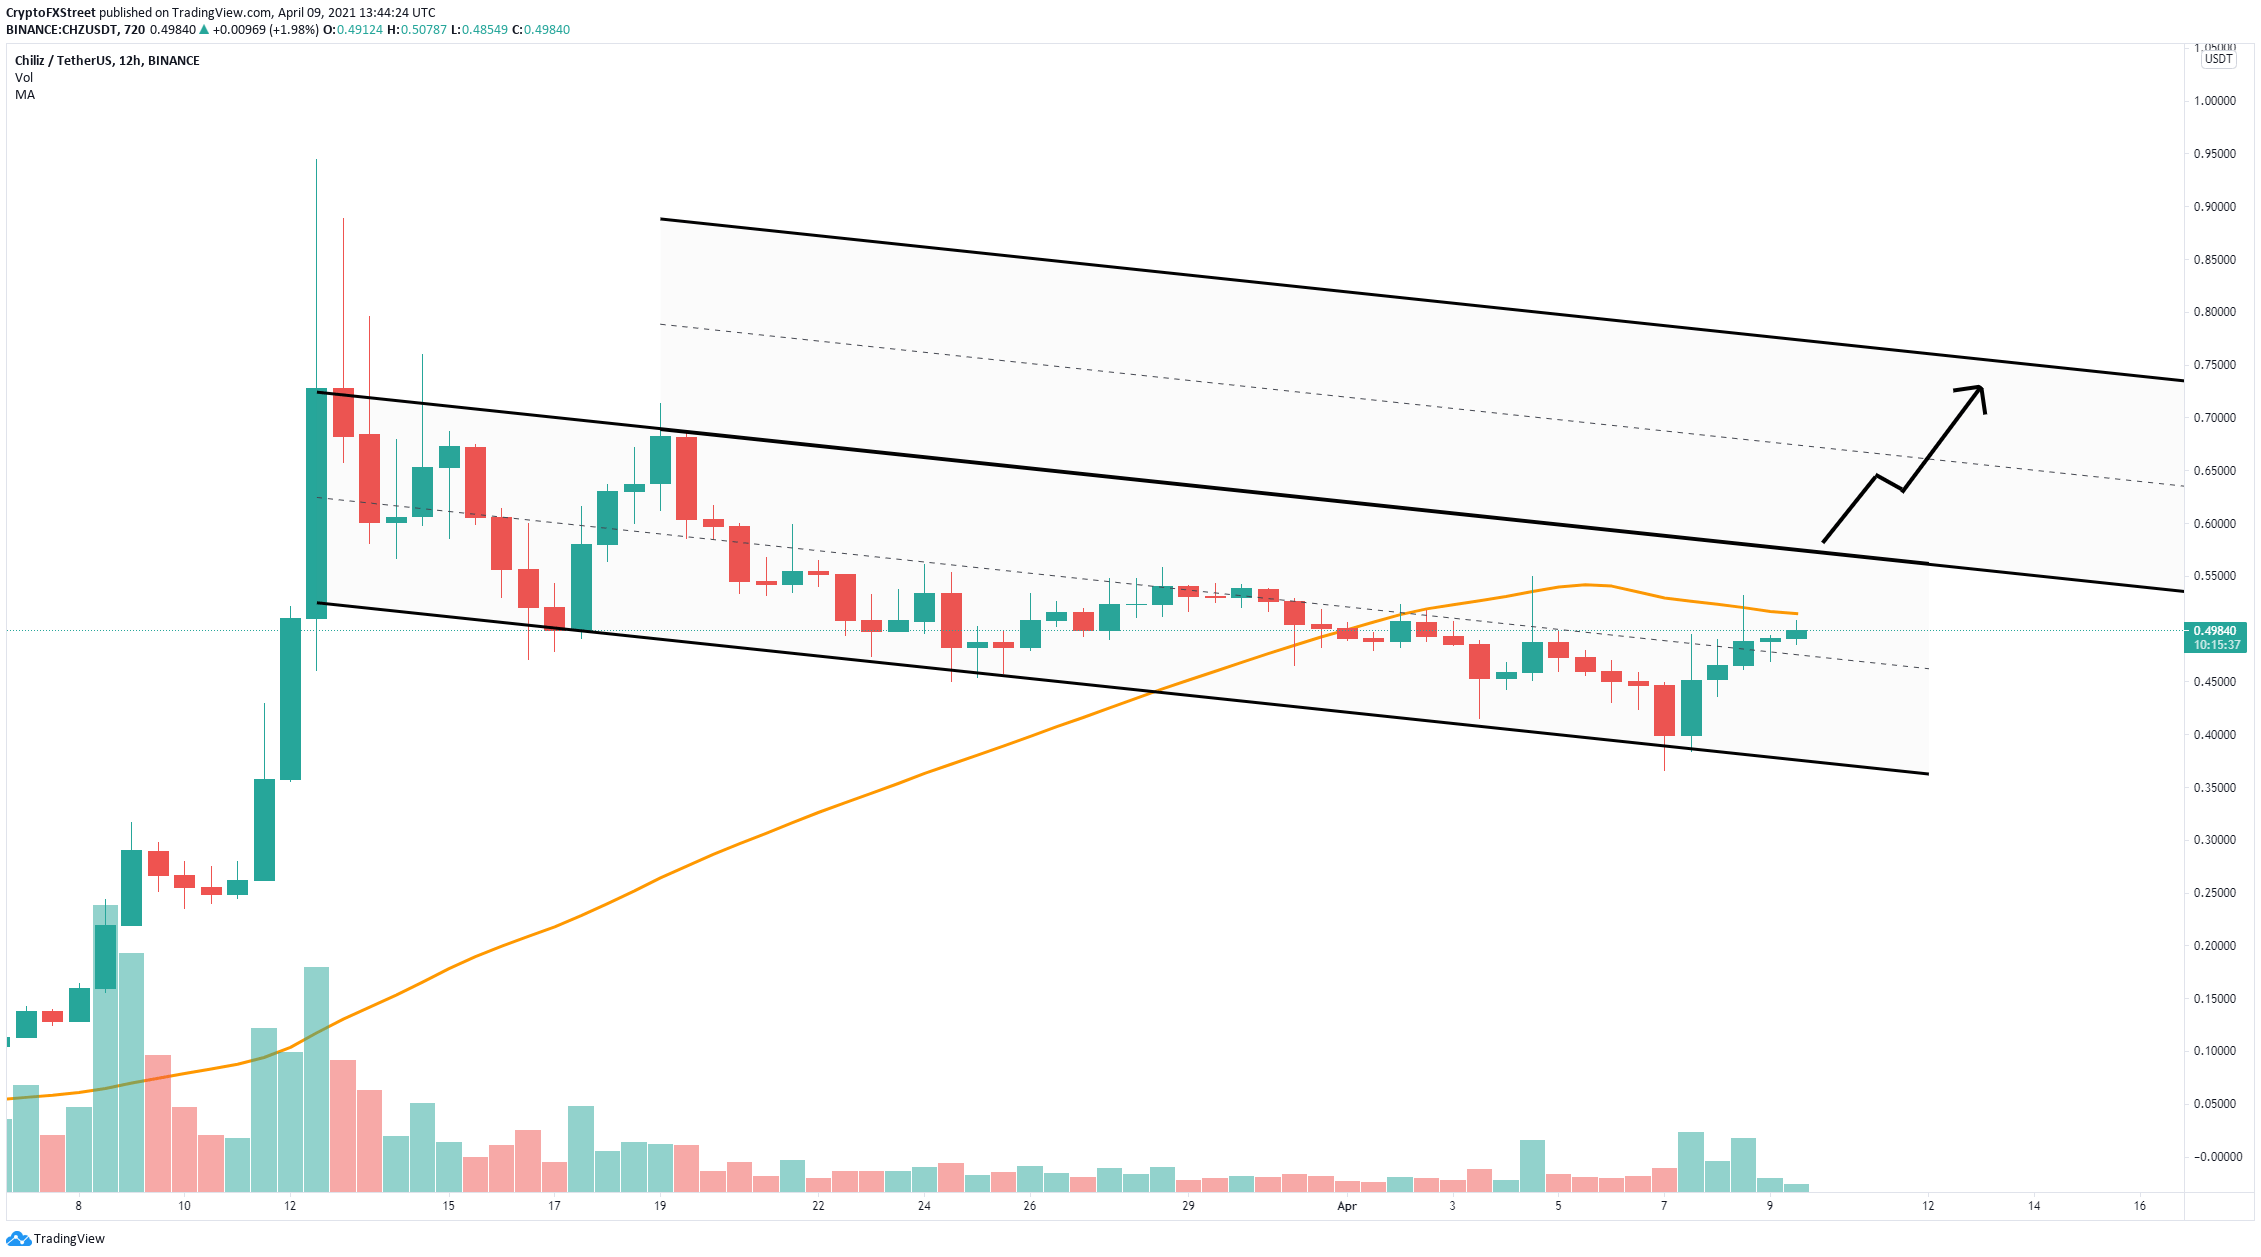
CHZ/USD 12-hour chart
Bulls need to push the Chiliz price above the 50 SMA first to get to $0.57, which is the upper boundary of the parallel channel. A breakout above this point should drive CHZ toward $0.65 initially and up to $0.75 in the longer term.
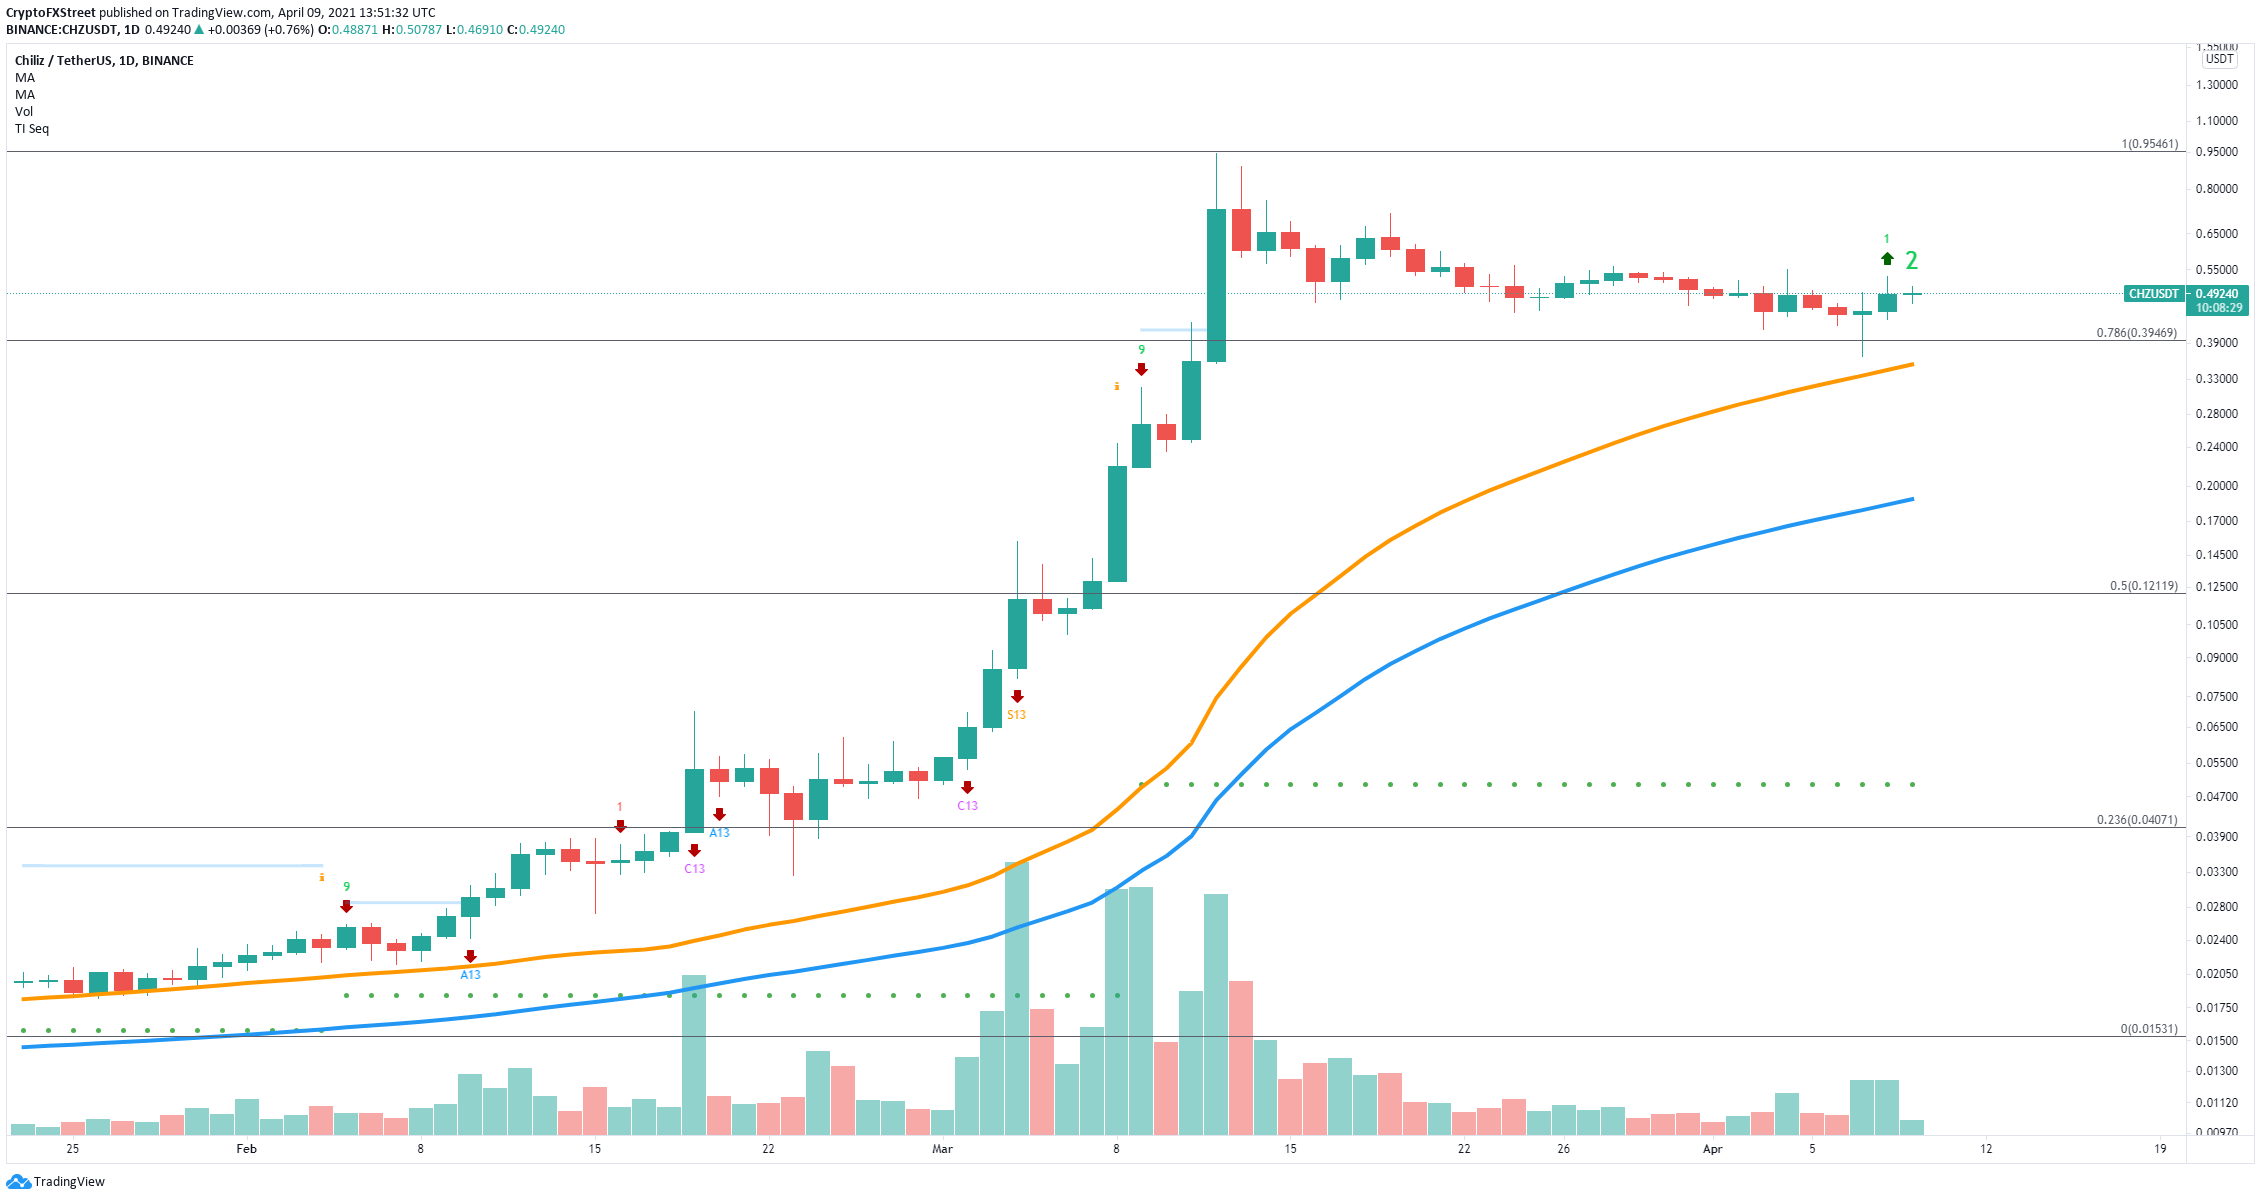
CHZ/USD daily chart
To add even more credence to the bullish outlook, the TD Sequential indicator presented a buy signal on April 8 on the daily chart, which has not been invalidated yet. To stop this signal from confirming, bears need to drive the Chiliz price below the low of $0.436.
A breakdown from this key point can quickly push CHZ down to the 78.6% Fibonacci level at $0.394 and the 50-day SMA at $0.355. The 100-day SMA support level is all the way down at $0.19 as CHZ has not formed many support points on the way up.
