- Chilliz price is consolidating inside a descending triangle formation.
- The recent 6-hour candlestick closed below the setup’s base, triggering a 47% crash.
- A decisive close above $0.58 will invalidate the bearish outlook.
Chiliz price seems to be leaning toward the sellers as it broke out of a bearish pattern recently.
Chiliz price kickstarts a downtrend
Chiliz price has been forming a series of lower highs since hitting a local top at $0.95, suggesting aggressive sellers. So far, the bulls seem to be defending these minor corrections, which has created a horizontal support level at $0.49.
If trend lines connecting the swing highs and the demand barrier were to be drawn, Chiliz price reveals a descending triangle pattern in play. This setup forecasts a 47% crash to $0.26, determined by measuring the distance between the pivot high and flat support and adding it to the breakout point at $0.49.
The recent 6-hour candlestick has already closed below the flat support, which indicates the start of a downtrend. Interestingly, the target at $0.26 coincides with the 61.8% Fibonacci retracement level.
Investors need to be wary of the 100 Simple Moving Average (SMA) on the 6-hour chart at $0.37, which could deter the downtrend.
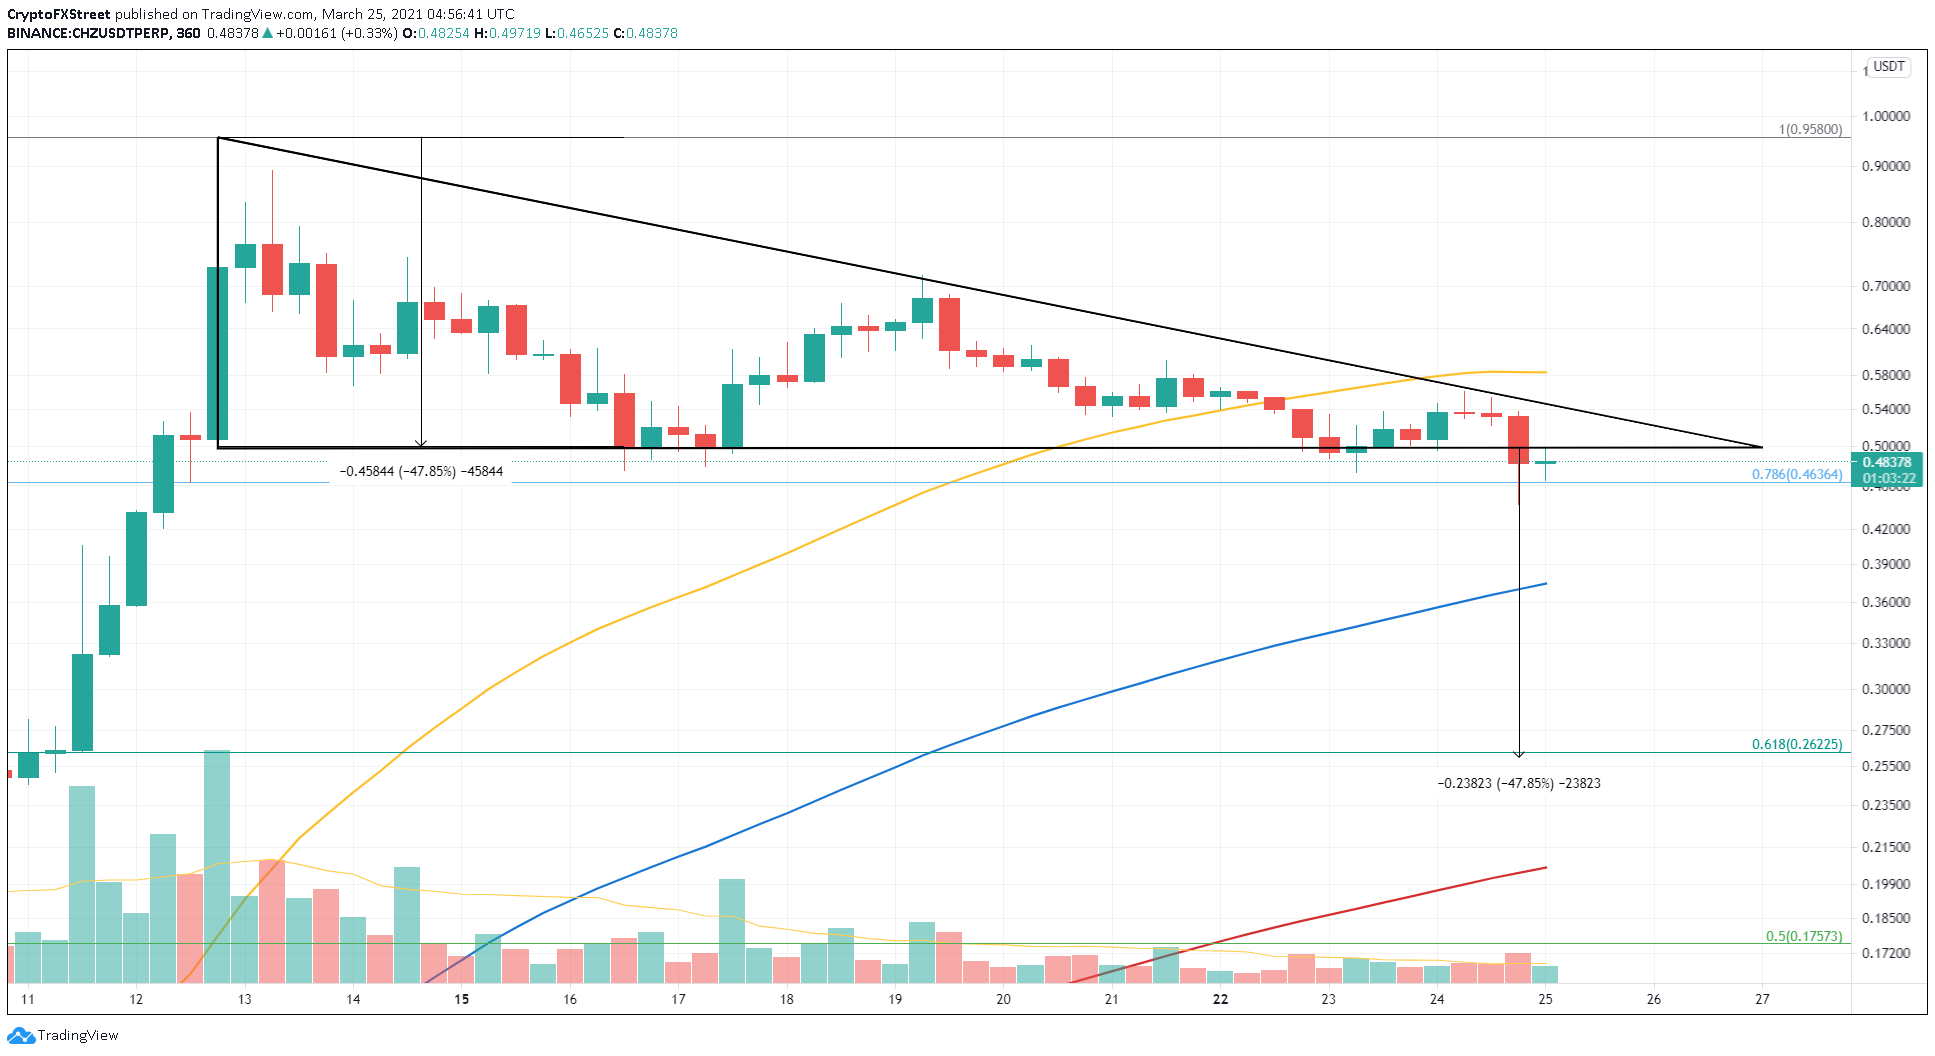
CHZ/USDT 6-hour chart
The demand barrier at $0.37 could do more than just deter the downtrend. If buyers begin to pile up around this level, a full-blown reversal could occur. However, to invalidate the bearish scenario, bullish momentum needs the Chiliz price to bust through the 50 SMA at $0.58.
In such a case, CHZ could continue its ascent to retest the all-time high at $0.95.
