- COMP price faces a critical barrier at $101, but on-chain metrics suggest it can experience a rally.
- The number of new users joining the Compound network has skyrocketed by 350%.
According to recent statistics provided by Dune Analytics, the total number of Compound users has skyrocketed by 350% in the past month, reaching a total of 175,000 users. It seems that the most significant spike happened on October 16. Compound price could be on the verge of a breakout thanks to the recent interest shown by new users.

Compound New Users chart
The number of users joining the Compound network has been slowly increasing since July 2019 and had a notable spike in July 2020 as the digital asset hit the market. The most recent colossal rise was unexpected, but a strong bullish indicator that new users are really interested in the digital asset despite its decline in value.
Compound faces one last barrier before a potential run to $120
From a technical view, Compound price formed an equilibrium pattern with a lower high at $101 and a higher low at $96.62 on the 4-hour chart. It seems that COMP broke out of this pattern in the past 24 hours, reaching $102.96 but getting rejected from the 200-SMA.
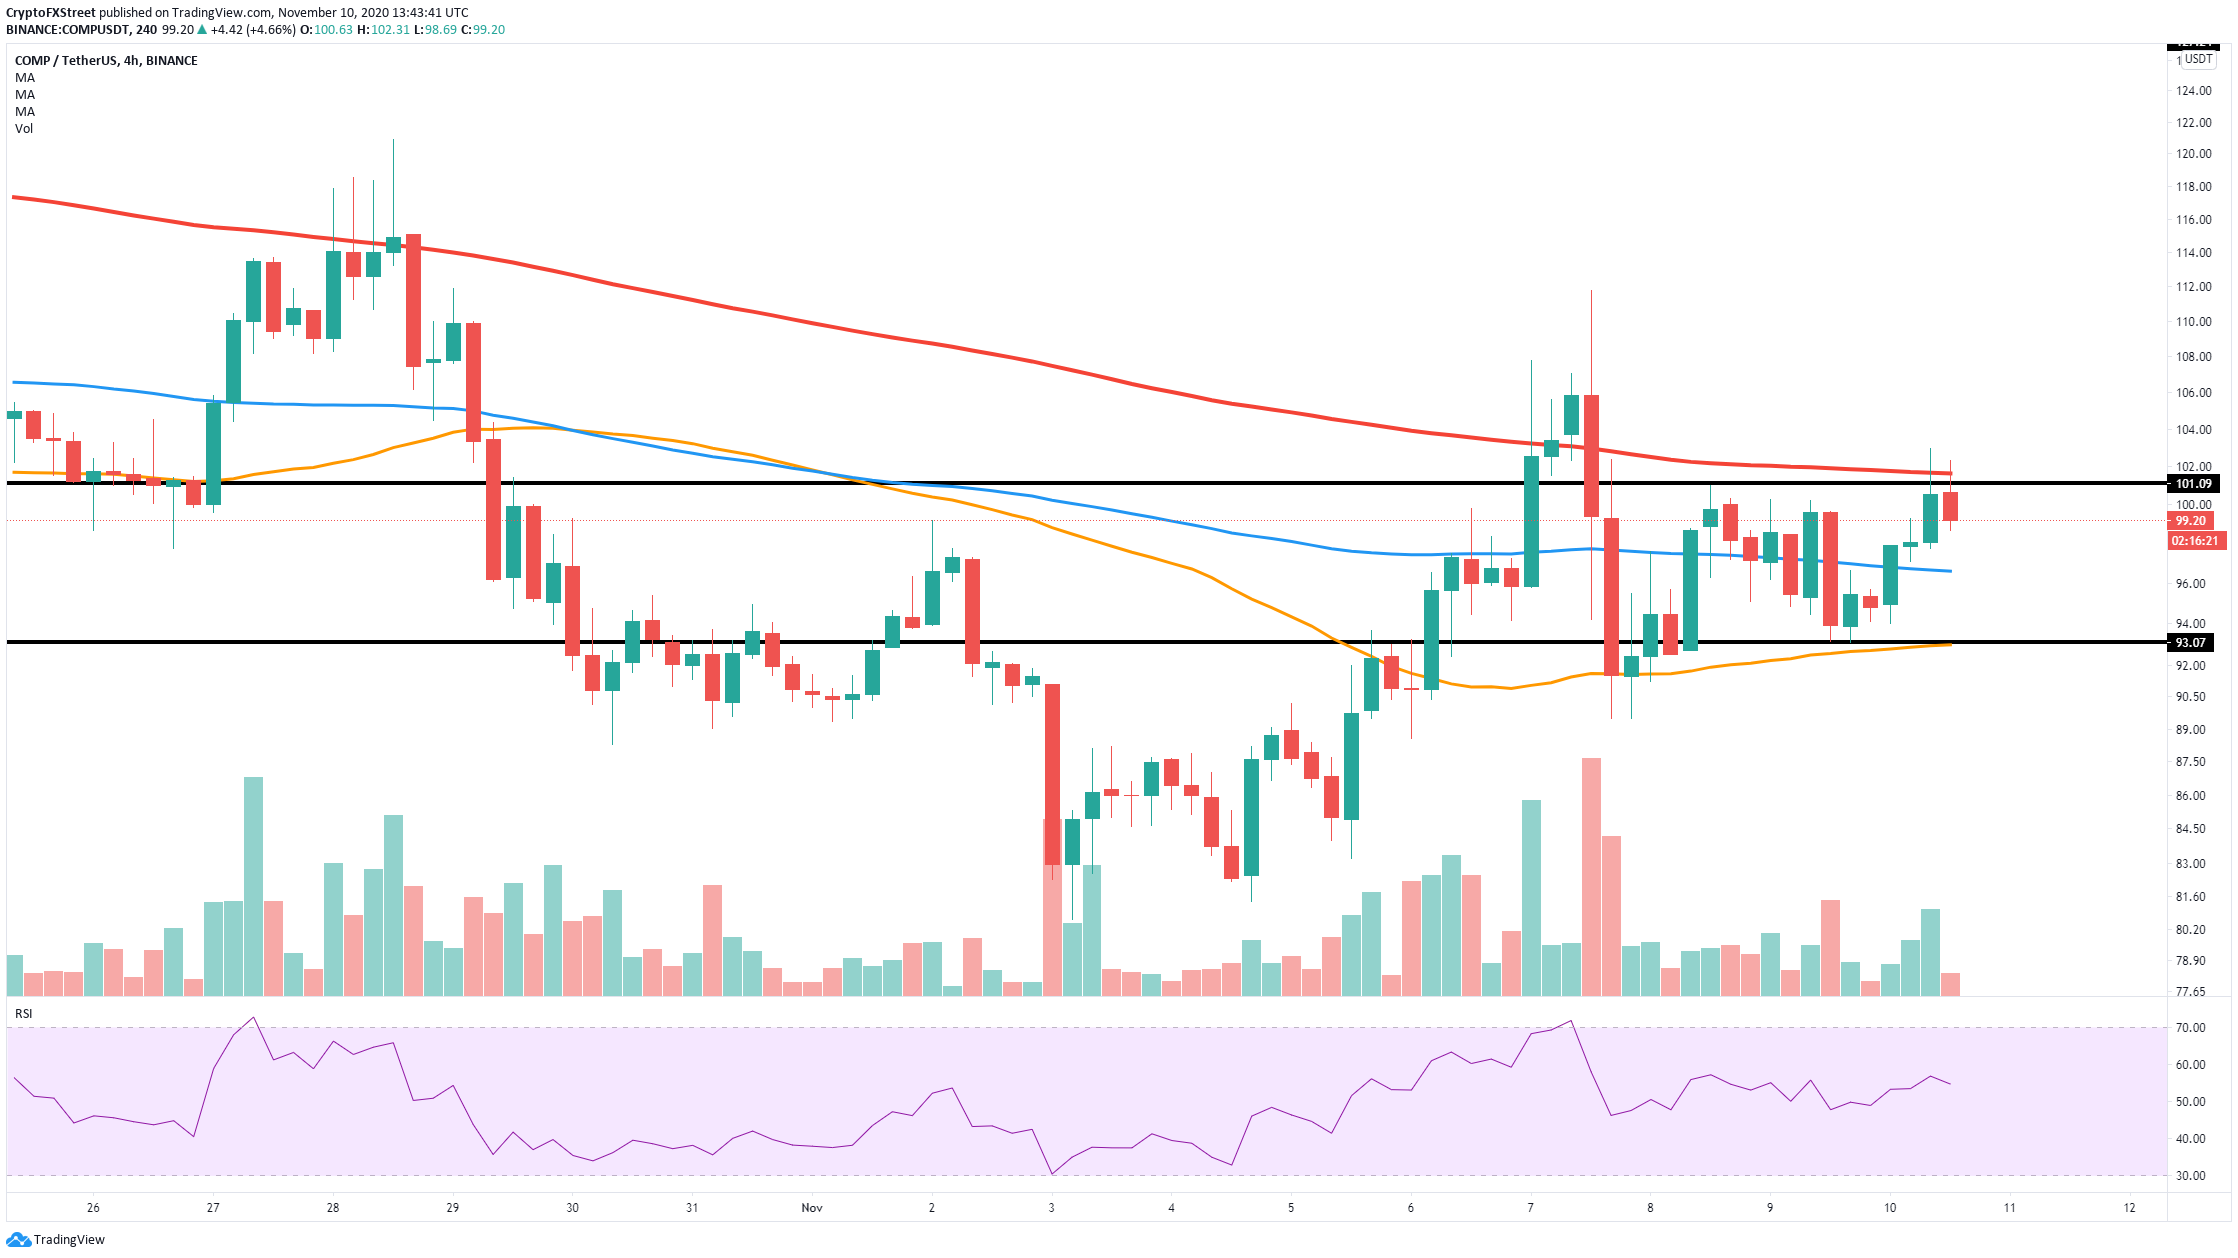
COMP/USD 4-hour chart
The 200-SMA at $102 is now the most critical resistance level in the short-term. A breakout above this point can drive Compound price towards the high of $111.8 and potentially towards $120.
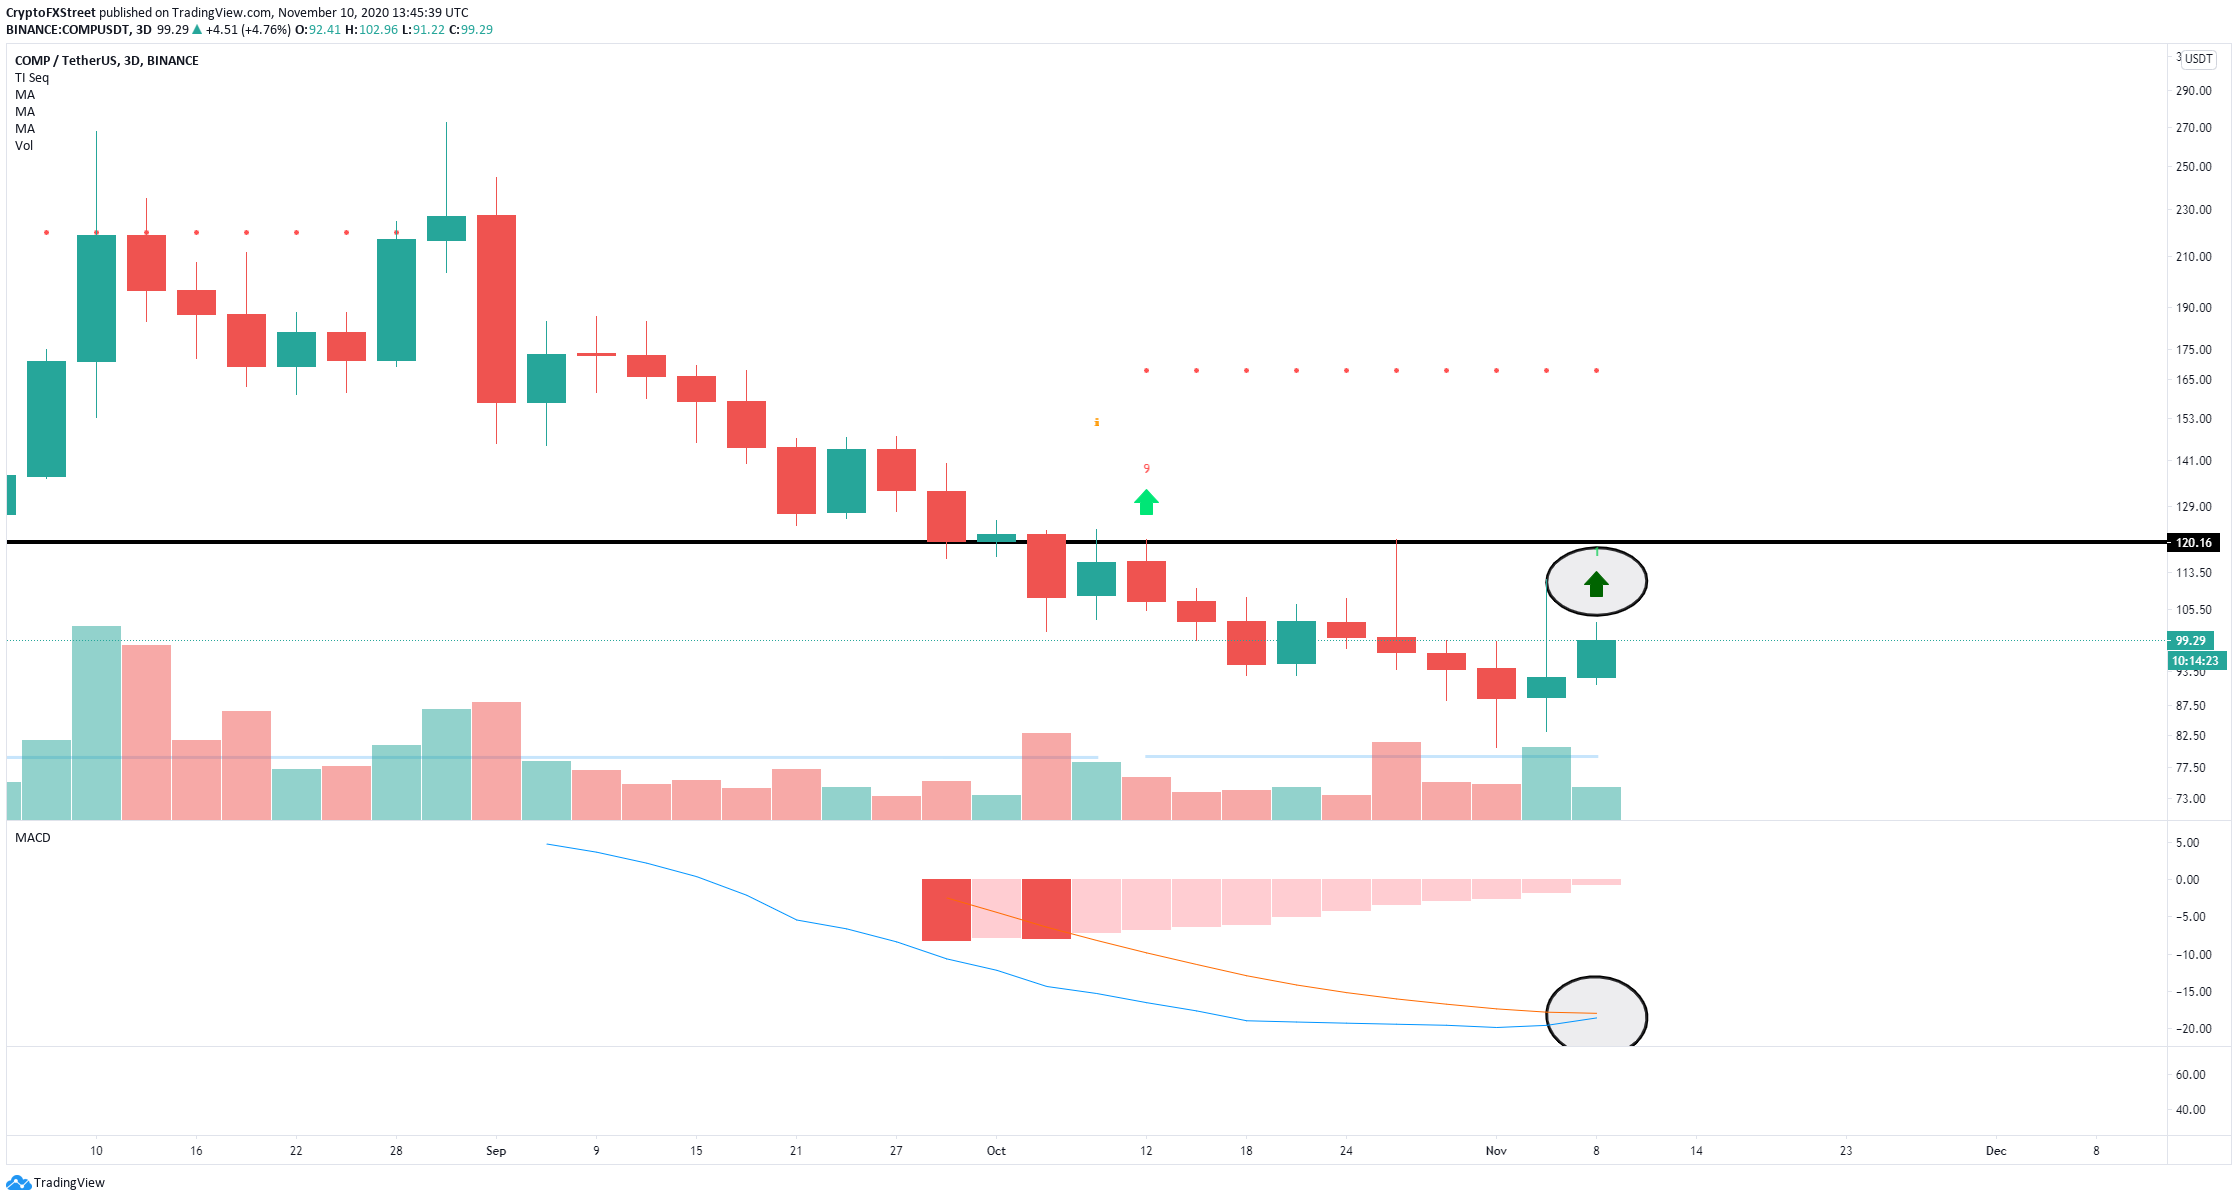
COMP/USD 3-day chart
Additionally, the TD Sequential indicator has presented a buy signal on the 3-day chart as the MACD is on the verge of a bullish cross for the first time ever. The price target on the 3-day chart seems to be the same at $120.
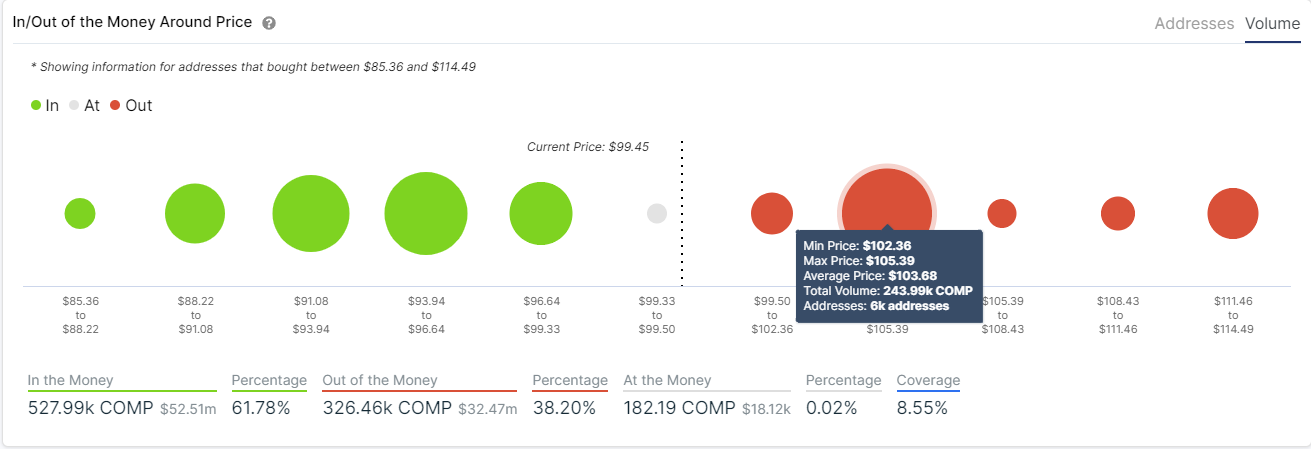
COMP IOMAP chart
However, the In/Out of the Money Around Price (IOMAP) chart shows a stiff resistance barrier between $102 and $105, where 6,000 addresses purchased close to 244,000 COMP tokens. The $102 level coincides with the 200-SMA on the 4-hour chart. Rejection from this resistance point can push Compound price towards $93.
