- COMP is currently trading at $152 and has established a double bottom.
- The digital asset is down 44% since its all-time high at $276.5.
Compound was one of the most successful DeFi projects to hit the market, jumping towards $1 billion in market capitalization just days after getting listed. Compound is still ranked 41st, and bulls are looking for a clear breakout to the upside.
COMP/USD 12-hour chart
-637359490642992172.png)
On the 12-hour chart, the TD sequential created a strong buy signal right after COMP price managed to defend $145, a support level established on September 6. The price formed a clear double bottom, which is also considered bullish. Similarly, the RSI has also defended the same level.
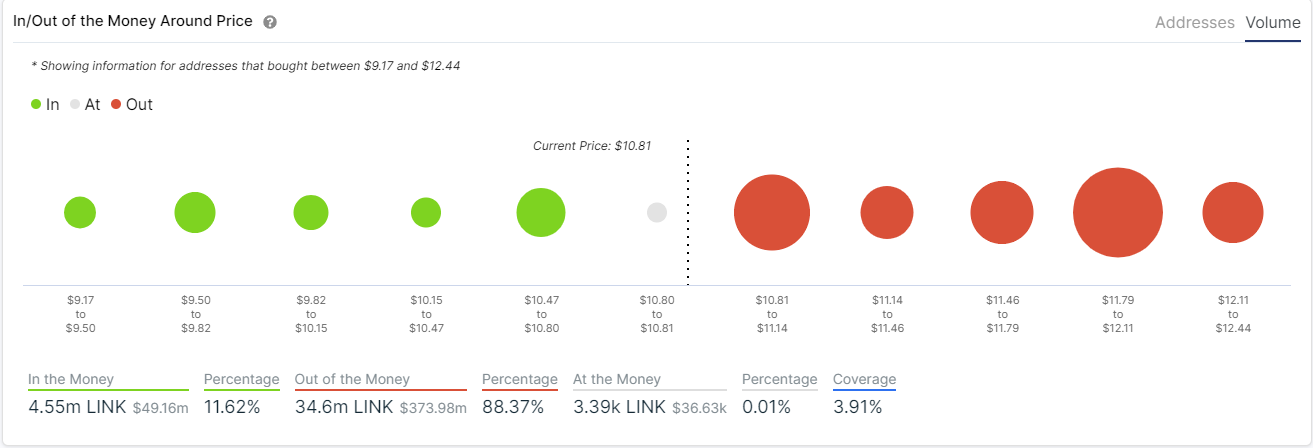
IOMAP Chart
Not only that, but the Bollinger Bands are getting squeezed significantly, indicating that a big move might happen soon. Unfortunately, the IOMAP chart shows little support between $151 and $140, which means that a bearish breakout would be devastating for COMP and could bring the digital asset down to $110.
If the buy signal gets a continuation move, the next most significant resistance cluster is found at $168.
COMP/USD 4-hour chart
-637359491314159085.png)
After holding another double bottom at $147, bulls are ready to bounce towards the next most crucial short-term resistance at $159.6. A clear breakout and close above this level should validate the buy signal on the 12-hour chart.
