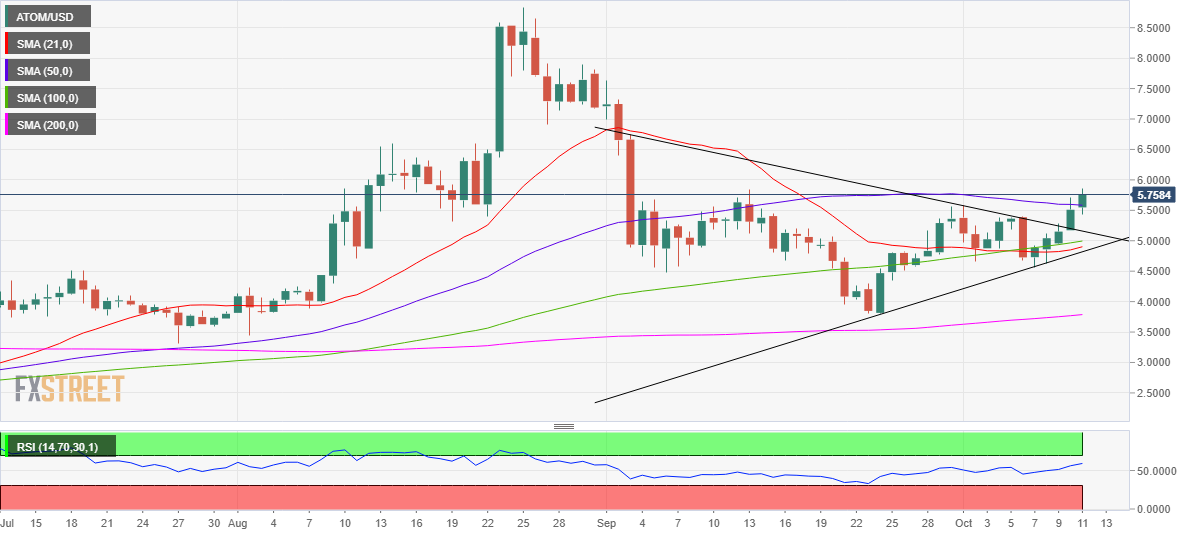
- Cosmos challenging critical resistance near $5.85 region.
- The No. 21 coin charts a symmetrical triangle breakout on daily sticks
- ATOM/USD’s path of least resistance is to the upside.
Cosmos (ATOM/USD) hovers near six-week highs of $5.86, consolidating the five-day winning streak on Sunday.
Despite a pause in the rally over the last hour, the bullish momentum remains intact amid a symmetrical triangle pattern confirmed on the daily chart on Saturday.
A decisive break above the horizontal 50-daily moving average (DMA) seen earlier on the day, bolstered the bullish sentiment around Cosmos.
Note that the spot last closed above the said resistance on September 12. Therefore, buyers eye a daily closing above 50-DMA to create fresh long positions. The 14-day Relative Strength Index edges higher above the 50 level, allowing more gains.
Following the triangle breakout above the $5.20 hurdle, the bulls now gather pace for a test of the pattern target aligned just above the $8 mark over the coming weeks.
Ahead of that level, the September 3 high of $6.73 could probably be challenged.
To the downside, the immediate cushion awaits at the pattern resistance-turned-support, currently at $5.16.
The next cap is aligned at the confluence zone of the 21 and 100-DMAs around $4.95. The latter is the last hope for the ATOM bulls.

