- Cosmos faces rejection just shy of $8.0 but takes out key resistance levels.
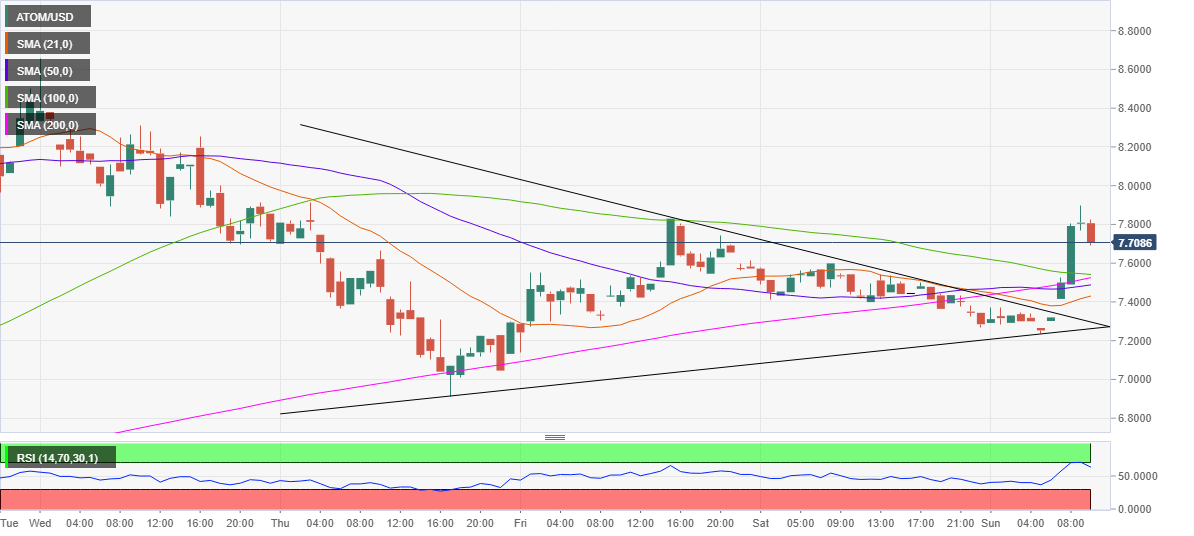
- ATOM/USD bulls carve out a symmetrical triangle breakout on a 1H chart.
- RSI suggests there is more room to the upside amid a broad buying spree.
As altcoins fuel a buying-wave across the crypto board this Sunday, Cosmos (ATOM/USD) has once again gained the bullish momentum after Saturday’s decline.
The digital asset is looking to recapture the $8.0 level after the symmetrical triangle breakout witnessed on the hourly chart earlier on in the day.
The hourly Relative Strength Index (RSI) stays bullish and probes the overbought territory, currently sitting at 69.0. This suggests that there is a scope for the further upside.
Acceptance above the $8.0 mark, the buyers could aim for the pattern target at $8.26.
To the downside, the immediate cushion is seen $7.53, where the bearish 100-hourly Simple Moving Average (HMA) meets the upward-sloping 200-HMA.
The bulls could also meet fresh demand at $7.48, the horizontal 50-HMA. Further down, the 21-HMA at $7.43 will be probed. The bearish momentum could accelerate below the latter opening floors for a test of the daily low of $7.23.
ATOM/USD hourly chart